Source page: McKinsey & Company
Commentary
Workforce wanted
Jobs | Future of Work | Productivity
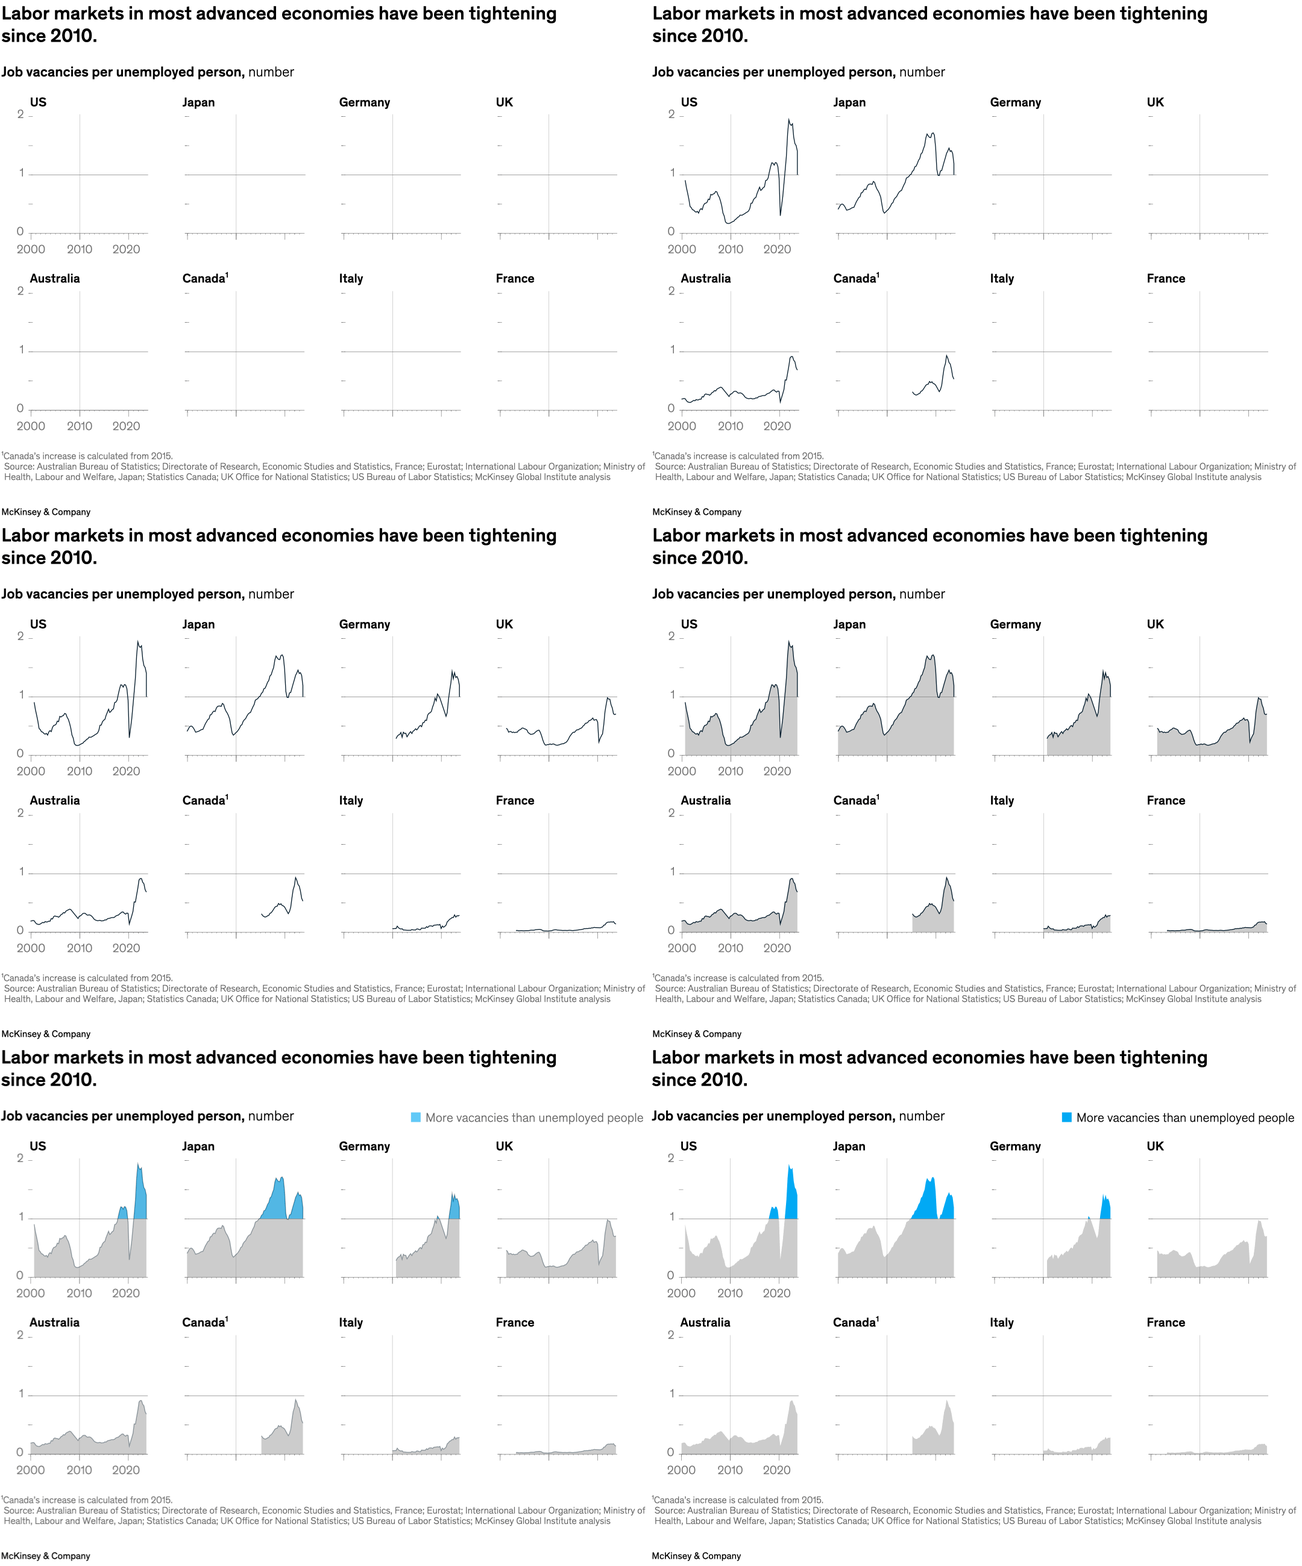
July 23, 2024 – Across dozens of advanced economies, the appetite to hire is outpacing the number of people seeking employment. From 2010 to 2023, the number of job vacancies per unemployed person increased more than fourfold, on average, in these countries, senior partner and McKinsey Global Institute chair Sven Smit and colleagues explain. The findings point to a trend that may continue as the global workforce ages.
To read the article, see “Help wanted: Charting the challenge of tight labor markets in advanced economies,” June 26, 2024.
customizer here
Visual form
Small-multiple area charts.
Layout / body structure
The visual is arranged as eight country mini-charts in a grid, each using the same vertical scale and a shared horizontal timeline so the reader compares labor-market tightness country by country.
What is being compared
It compares job vacancies per unemployed person across the US, Japan, Germany, the UK, Australia, Canada, Italy, and France over time.
Measurement system
The measure is a ratio, with the horizontal reference line at 1 marking the point where vacancies equal unemployed people and the blue highlight indicating periods when vacancies exceed unemployment.
Visible structure inside the graphic
Each country panel uses a filled area series, mostly gray below the threshold and bright blue where the series rises above 1, making it easy to see which labor markets move into shortage territory and for how long.
Main takeaway from the visual
The chart shows tightening labor markets across most advanced economies, but the degree differs sharply: the US, Japan, and Germany spend meaningful time above the one-vacancy-per-unemployed threshold, while France and Italy remain far below it.
Key standout values or extremes
The US peaks near 2 vacancies per unemployed person, Japan climbs well above 1.5, Germany rises above 1, while the UK hovers around but mostly below 1 and France and Italy stay near the bottom of the scale throughout.
Controls / sequence, when applicable
This is a static chart image with no in-chart controls to operate.
Companion media, when applicable
There is no separate companion audio or video; the chart image is the full visual on this page.