Source page: McKinsey & Company
Commentary
Shipbuilding talent may be adrift
Shipping | Manufacturing | Supply Chain Management
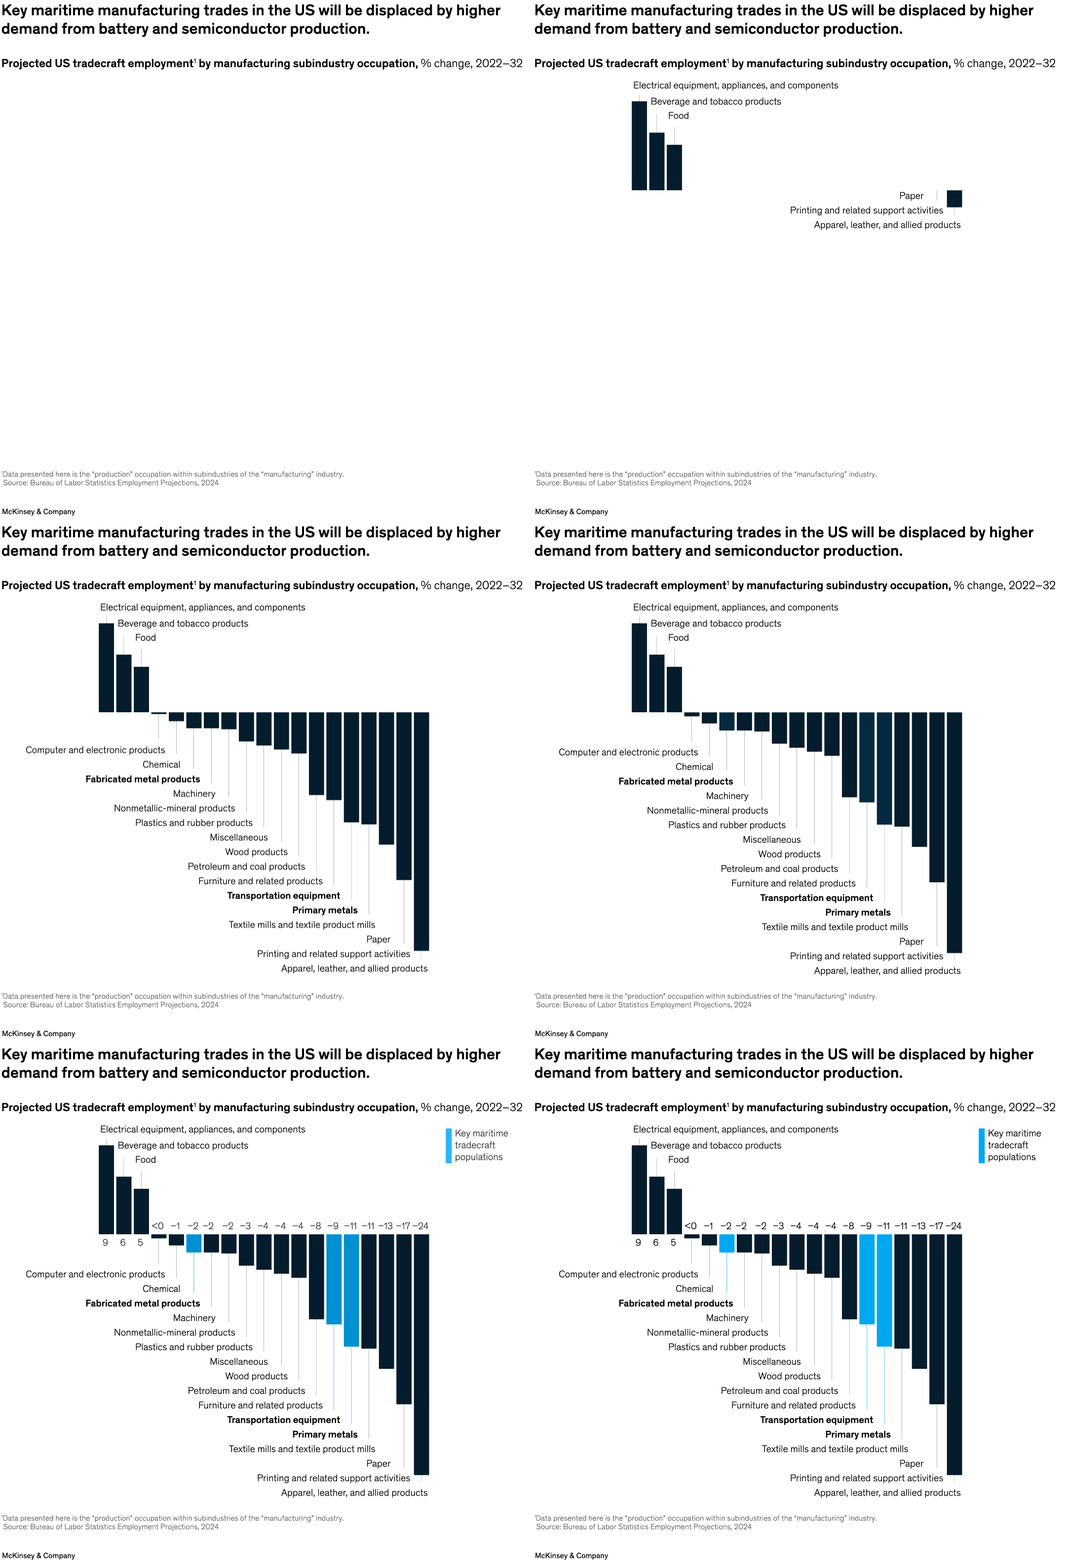
July 8, 2024 – Demand for commercial ships is on course to grow, but talent supply may be adrift in today’s market. Thirty-three thousand new jobs are expected by 2032 in maritime-adjacent subindustries such as electrical equipment, appliances, and components, and computer and electronic products. But key maritime industries are poised to shrink, senior partner Brooke Weddle and coauthors find. The fabricated metal products, transportation equipment, and primary metals industries may lose 39,000 jobs by 2032. Shipbuilders that are winning this battle for talent are doubling down on creating a talent advantage.
To read the article, see “Charting a new course: The untapped potential of American shipyards,” June 5, 2024.
customizer here
Visual form
Bar chart.
Layout / body structure
A single sorted chart runs left to right across the page, with positive industries grouped on the left and deeper declines stepping down on the right. The reading order is across the bars first and then down through the labeled subindustries and notes.
What is being compared
It compares projected tradecraft employment change across US manufacturing subindustries from 2022 to 2032, with special attention on the maritime talent pools highlighted inside the wider manufacturing set.
Measurement system
The measure is percentage change in employment. Zero sits at the midpoint, bars extend above or below that baseline, and the bright blue highlight identifies the key maritime tradecraft populations against the darker comparison bars.
Visible structure inside the graphic
Each subindustry is represented by one vertical bar. Electrical equipment, beverage and tobacco, and food rise above zero, while the rest descend through shallow declines into larger drops, with chemical, transportation equipment, and primary metals called out as the maritime-relevant bars.
Main takeaway from the visual
The chart shows that shipbuilding-relevant trade pools are being squeezed because higher-growth manufacturing segments pull labor upward while several maritime-relevant categories move into decline.
Key standout values or extremes
Electrical equipment rises about 9 percent, beverage and tobacco about 6 percent, and food about 5 percent. Transportation equipment falls about 9 percent and primary metals about 11 percent, while paper and printing sit among the deepest declines and apparel is the lowest bar overall.
Controls / sequence, when applicable
This is a static chart image with no in-chart controls to operate.
Companion media, when applicable
There is no separate companion audio or video; the chart image is the full visual on this page.