Source page: McKinsey & Company
Commentary
Is nearshoring in fashion?
Supply Chain Management | Fashion
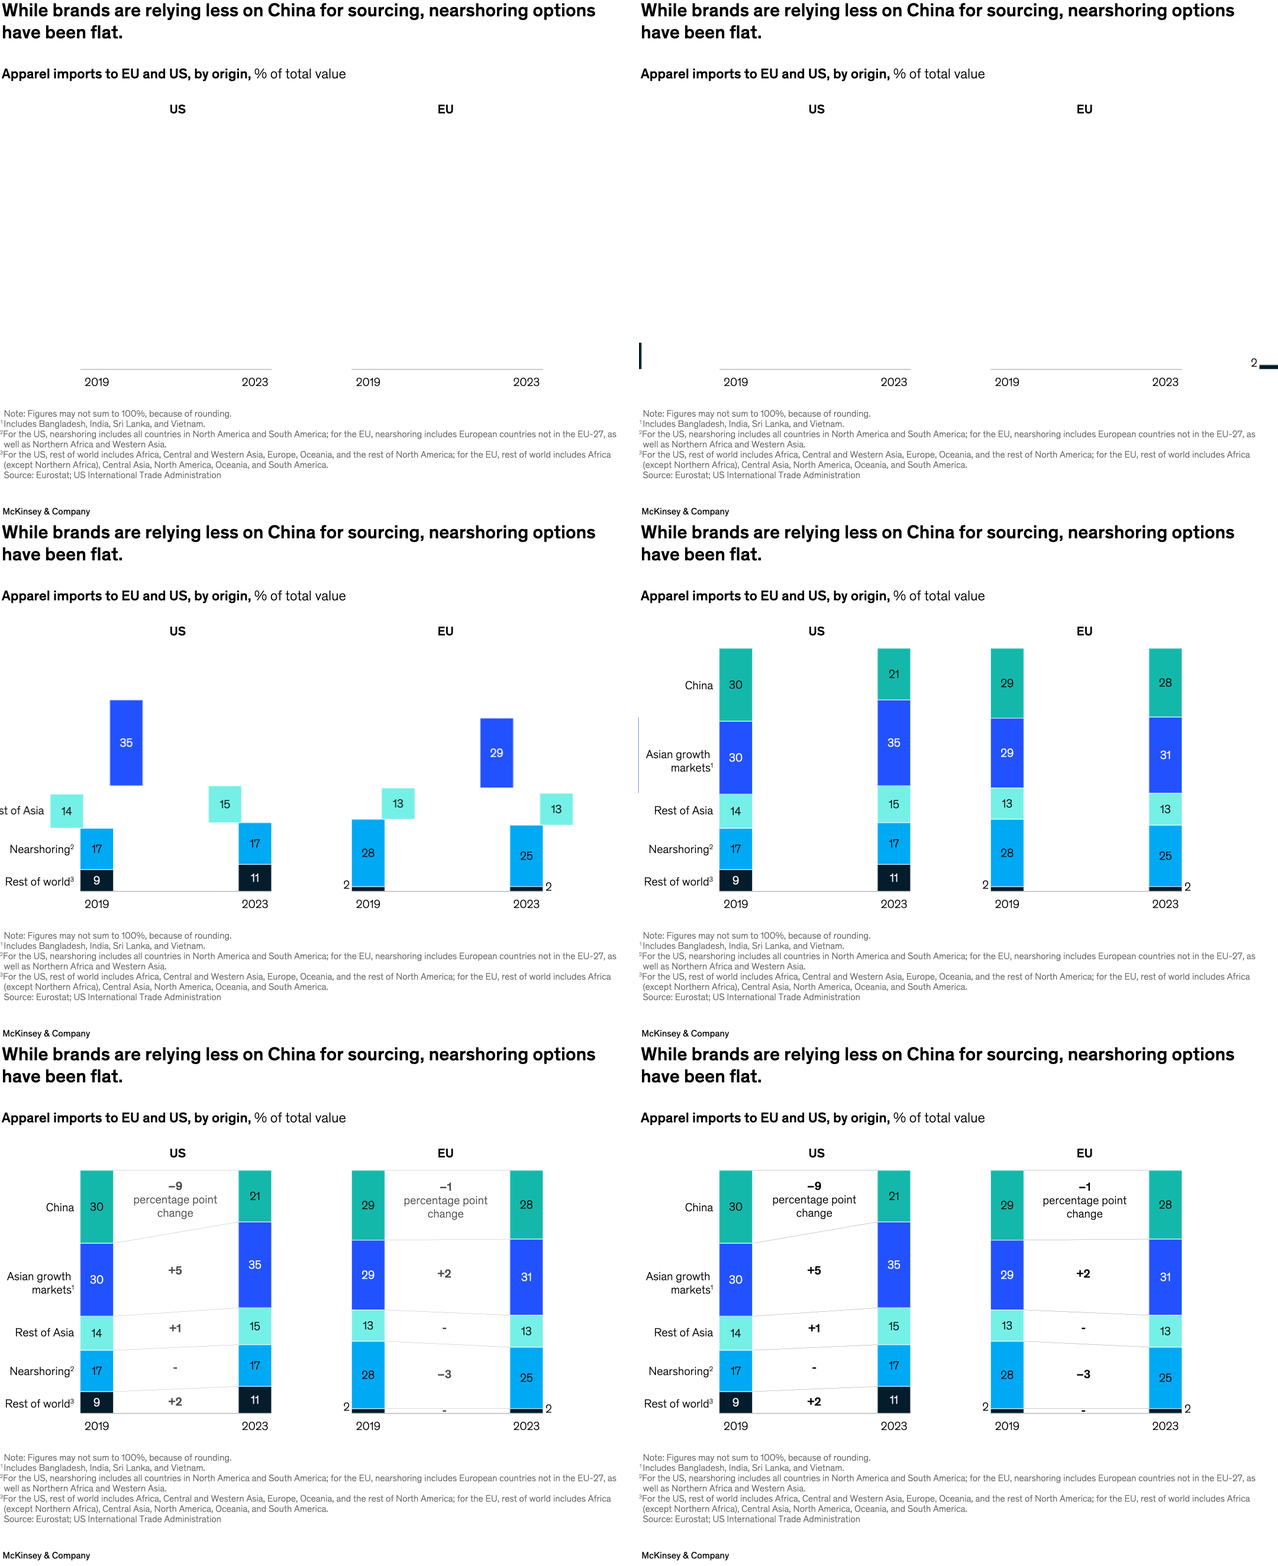
June 12, 2024 – Nearshoring—locating production close to consumer markets—has been a top priority for US and European apparel executives since 2016, according to McKinsey surveys. But in practice, nearshoring has remained flat, senior partner Karl-Hendrik Magnus and colleagues find. Although apparel companies are shifting sourcing away from China, production has moved primarily to other Asian countries.
To read the article, see “Reimagining the apparel value chain amid volatility,” May 24, 2024.
customizer here
Visual form
Stacked bar chart.
Layout / body structure
The chart is split into two side-by-side country-market panels, with the US on the left and the EU on the right. Within each panel, the reading order is from the 2019 stack to the 2023 stack, with the percentage-point change labels placed in the middle between them.
What is being compared
It compares apparel import sourcing by origin for the US and the EU, separating China, Asian growth markets, the rest of Asia, nearshoring, and the rest of the world.
Measurement system
The values are percentages of total apparel import value. Each stack sums the sourcing mix for a given year, and the center labels report the percentage-point change for each origin category from 2019 to 2023.
Visible structure inside the graphic
Each market has two stacked columns with matching colored segments for the sourcing regions. Thin guide lines connect like-for-like segments across years, and the middle column of labels makes the direction and size of each shift explicit.
Main takeaway from the visual
The graphic shows that dependence on China fell in both the US and the EU, but the share taken by nearshoring sources stayed flat in the US and actually slipped in the EU, so the shift away from China did not translate into a broad nearshoring surge.
Key standout values or extremes
In the US, China drops from 30 percent to 21 percent, a 9-point fall, while Asian growth markets rise from 30 percent to 35 percent. In the EU, China edges down from 29 percent to 28 percent, Asian growth markets rise from 29 percent to 31 percent, and nearshoring falls from 28 percent to 25 percent.
Controls / sequence, when applicable
This is a static chart image with no in-chart controls to operate.
Companion media, when applicable
There is no separate companion audio or video; the chart image is the full visual on this page.