Source page: McKinsey & Company
Commentary
Why women's health lags behind men's
Healthcare | Life Sciences | Inequality
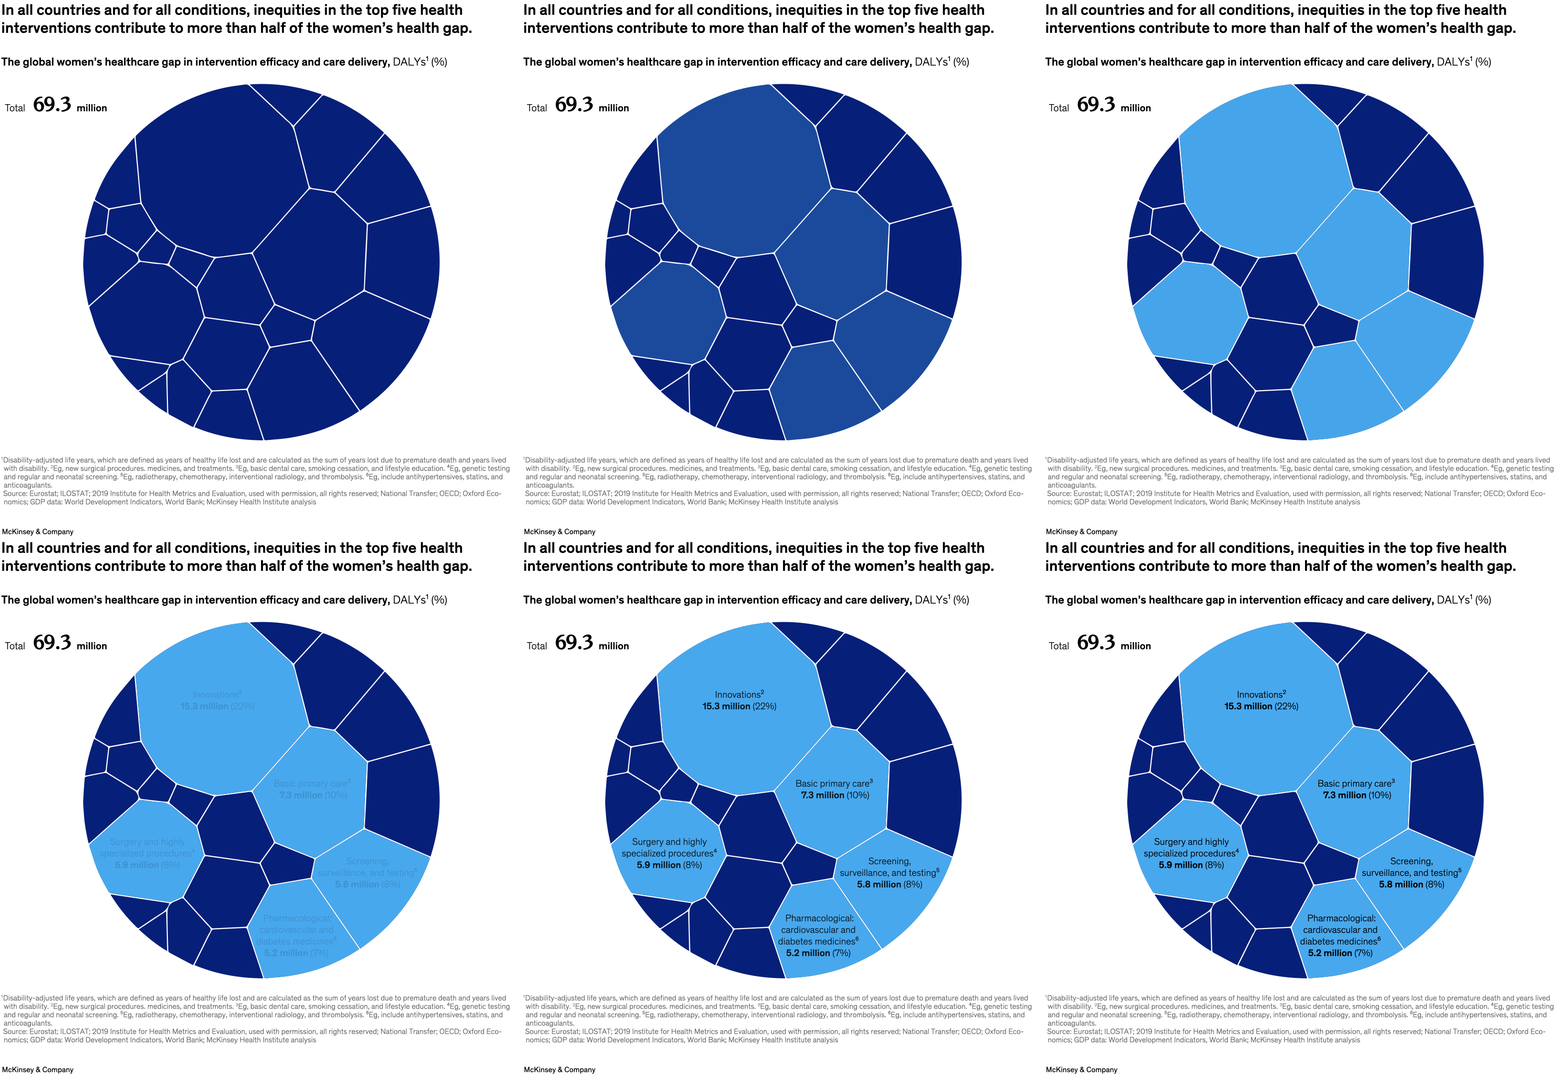
June 11, 2024 – Although women generally outlive men by about 4.5 years, they experience 25 percent more time in poor health. The main reasons for this discrepancy? Disparities in treatment efficacy, data, and care delivery, say senior partner Lucy Pérez and colleagues. In analyzing 22 types of interventions across the globe and for various diseases and conditions, inequities in efficacy and care delivery of the top five interventions contribute to 57 percent of the women’s health gap.
To view the interactive, see “Bridging the women’s health gap: A country-level exploration,” May 2024.
customizer here
Visual form
Treemap.
Layout / body structure
The page uses one large packed treemap circle with labeled blocks nested inside it. The reading order starts from the largest labeled tiles and then moves outward to the smaller surrounding intervention blocks.
What is being compared
It compares the women’s healthcare gap across intervention categories, showing how much of the total disability-adjusted life-year gap is tied to innovations, basic primary care, screening and testing, pharmacological care, surgery, and smaller remaining intervention areas.
Measurement system
The measure is DALYs, shown both in millions and as a percentage of the total 69.3 million. Larger tiles represent larger shares of the gap, and the labels inside the major tiles give both the absolute amount and the percent share.
Visible structure inside the graphic
The treemap is built from irregular polygon cells packed into a circular boundary. A few large light-blue tiles anchor the center and lower-right side of the visual, while many smaller dark-blue tiles fill the remaining space around them.
Main takeaway from the visual
The chart shows that a handful of intervention areas account for more than half of the women’s health gap, with innovation alone taking the largest share and several other care-delivery categories adding another large block of the total.
Key standout values or extremes
Innovations accounts for 15.3 million DALYs, or 22 percent, making it the biggest tile. Basic primary care contributes 7.3 million or 10 percent, screening and testing 5.8 million or 8 percent, surgery and highly specialized procedures 5.9 million or 8 percent, and pharmacological cardiovascular and diabetes medicines 5.2 million or 7 percent.
Controls / sequence, when applicable
This is a static chart image with no in-chart controls to operate.
Companion media, when applicable
There is no separate companion audio or video; the chart image is the full visual on this page.