Source page: McKinsey & Company
Commentary
Rate cut hopes take a nosedive
Inflation | Economy | Consumer
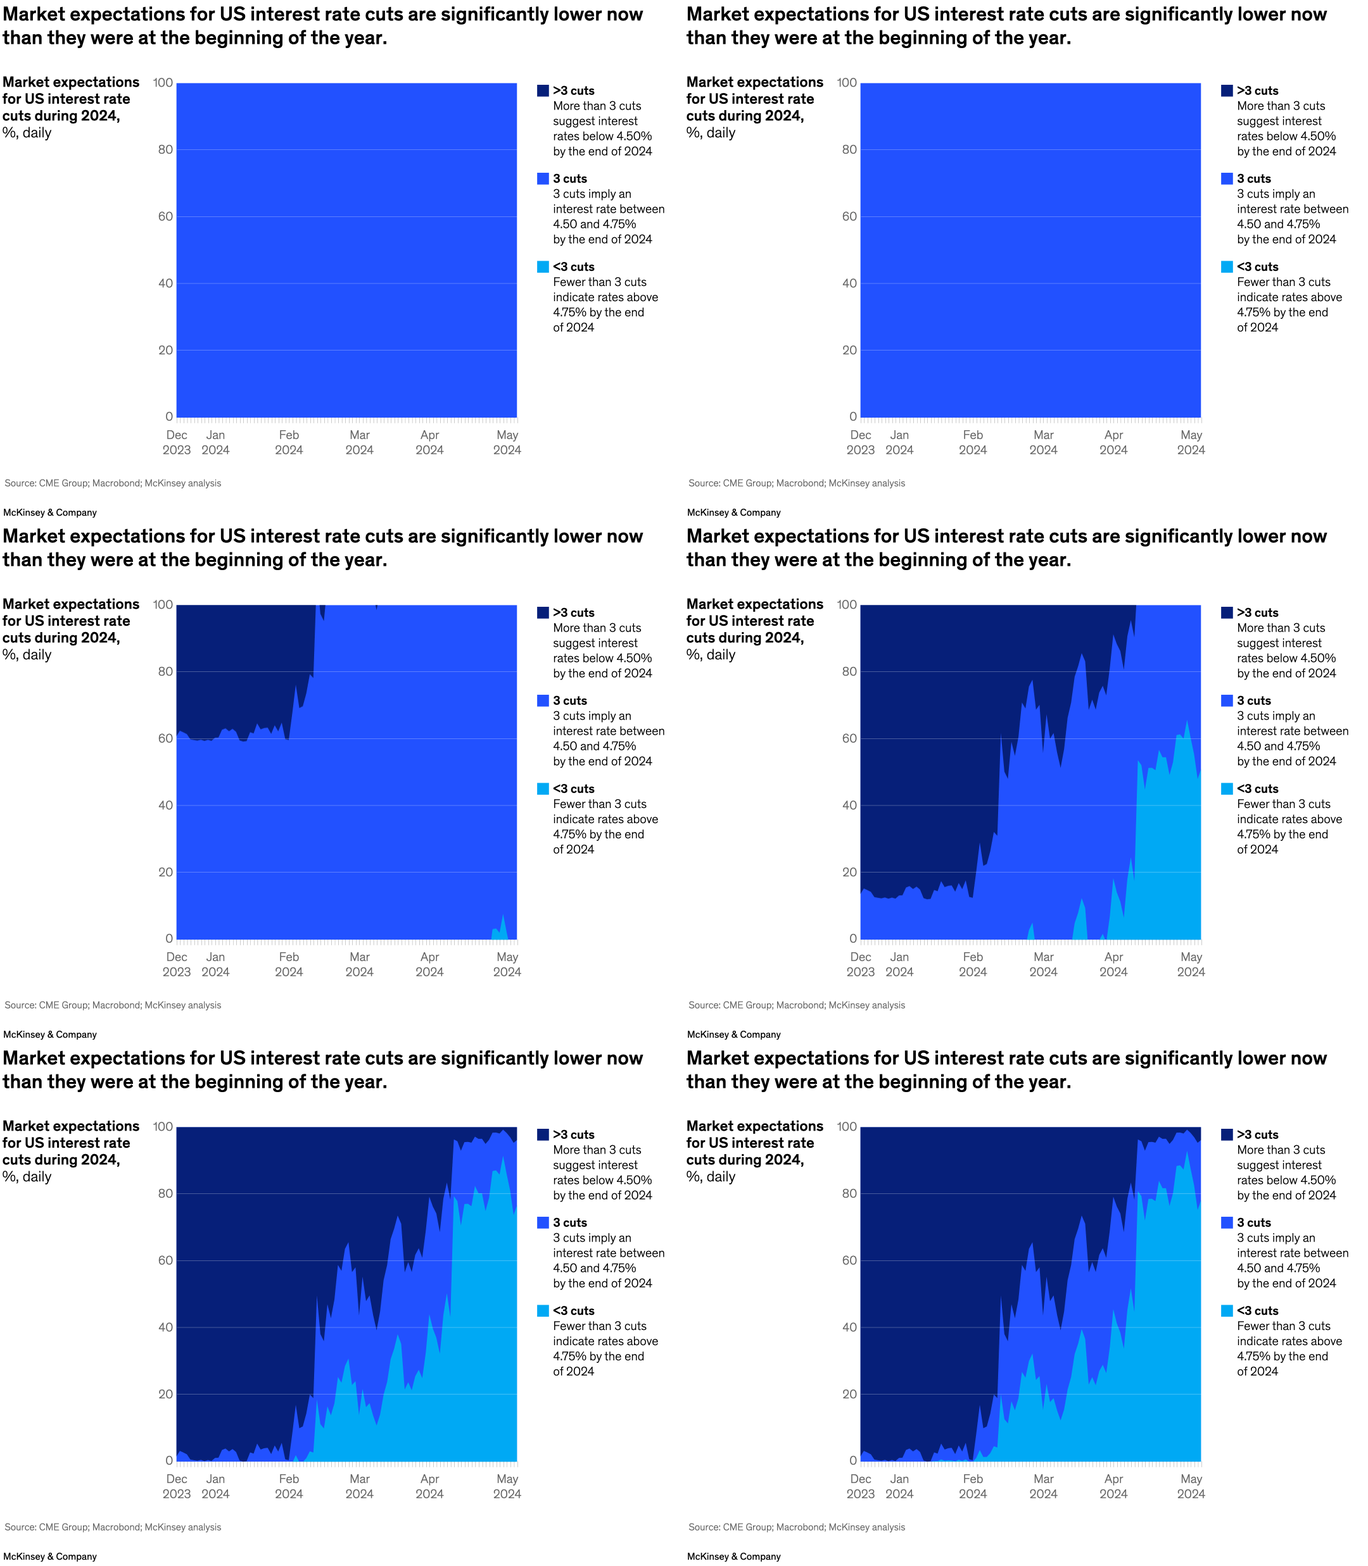
June 6, 2024 – Market expectations for US interest rate cuts in 2024 have declined significantly since the end of last year. Sven Smit, senior partner and chair of the McKinsey Global Institute, and coauthors find that the market is now mostly anticipating fewer than three cuts, a sharp decrease from the five cuts that many expected in January. This shift in expectations likely results from factors including sticky inflation and the Fed’s tight monetary policy.
To read the article, see “Global Economics Intelligence executive summary, April 2024,” May 21, 2024.
customizer here
Visual form
Area chart.
Layout / body structure
This is a single time-series area chart running from late 2023 into May 2024, with a legend block on the right. The reading order is left to right through the daily series and then into the legend definitions for the three cut scenarios.
What is being compared
It compares changing market expectations for how many US interest-rate cuts would happen during 2024, splitting the market view into fewer than three cuts, exactly three cuts, and more than three cuts.
Measurement system
The y-axis is percentage of market expectations on a daily basis and the x-axis is time from December 2023 to May 2024. The stacked colored areas show how the mix of rate-cut expectations shifts day by day.
Visible structure inside the graphic
Three stacked bands fill the chart area. The dark top band represents more than three cuts, the middle blue band represents three cuts, and the bright lower band represents fewer than three cuts, with the lower band expanding sharply toward the end of the series.
Main takeaway from the visual
The chart shows that market expectations moved decisively away from aggressive rate cuts as the year unfolded, with the under-three-cuts scenario growing much more prominent by spring.
Key standout values or extremes
At the start of the year the market is dominated by the more-than-three-cuts scenario, but by late April and May the fewer-than-three-cuts band rises to occupy most of the stack while the more-than-three-cuts band shrinks to a thin top layer.
Controls / sequence, when applicable
This is a static chart image with no in-chart controls to operate.
Companion media, when applicable
There is no separate companion audio or video; the chart image is the full visual on this page.