Source page: McKinsey & Company
Commentary
Amplify thriving talent
Productivity | Workplace | Leadership
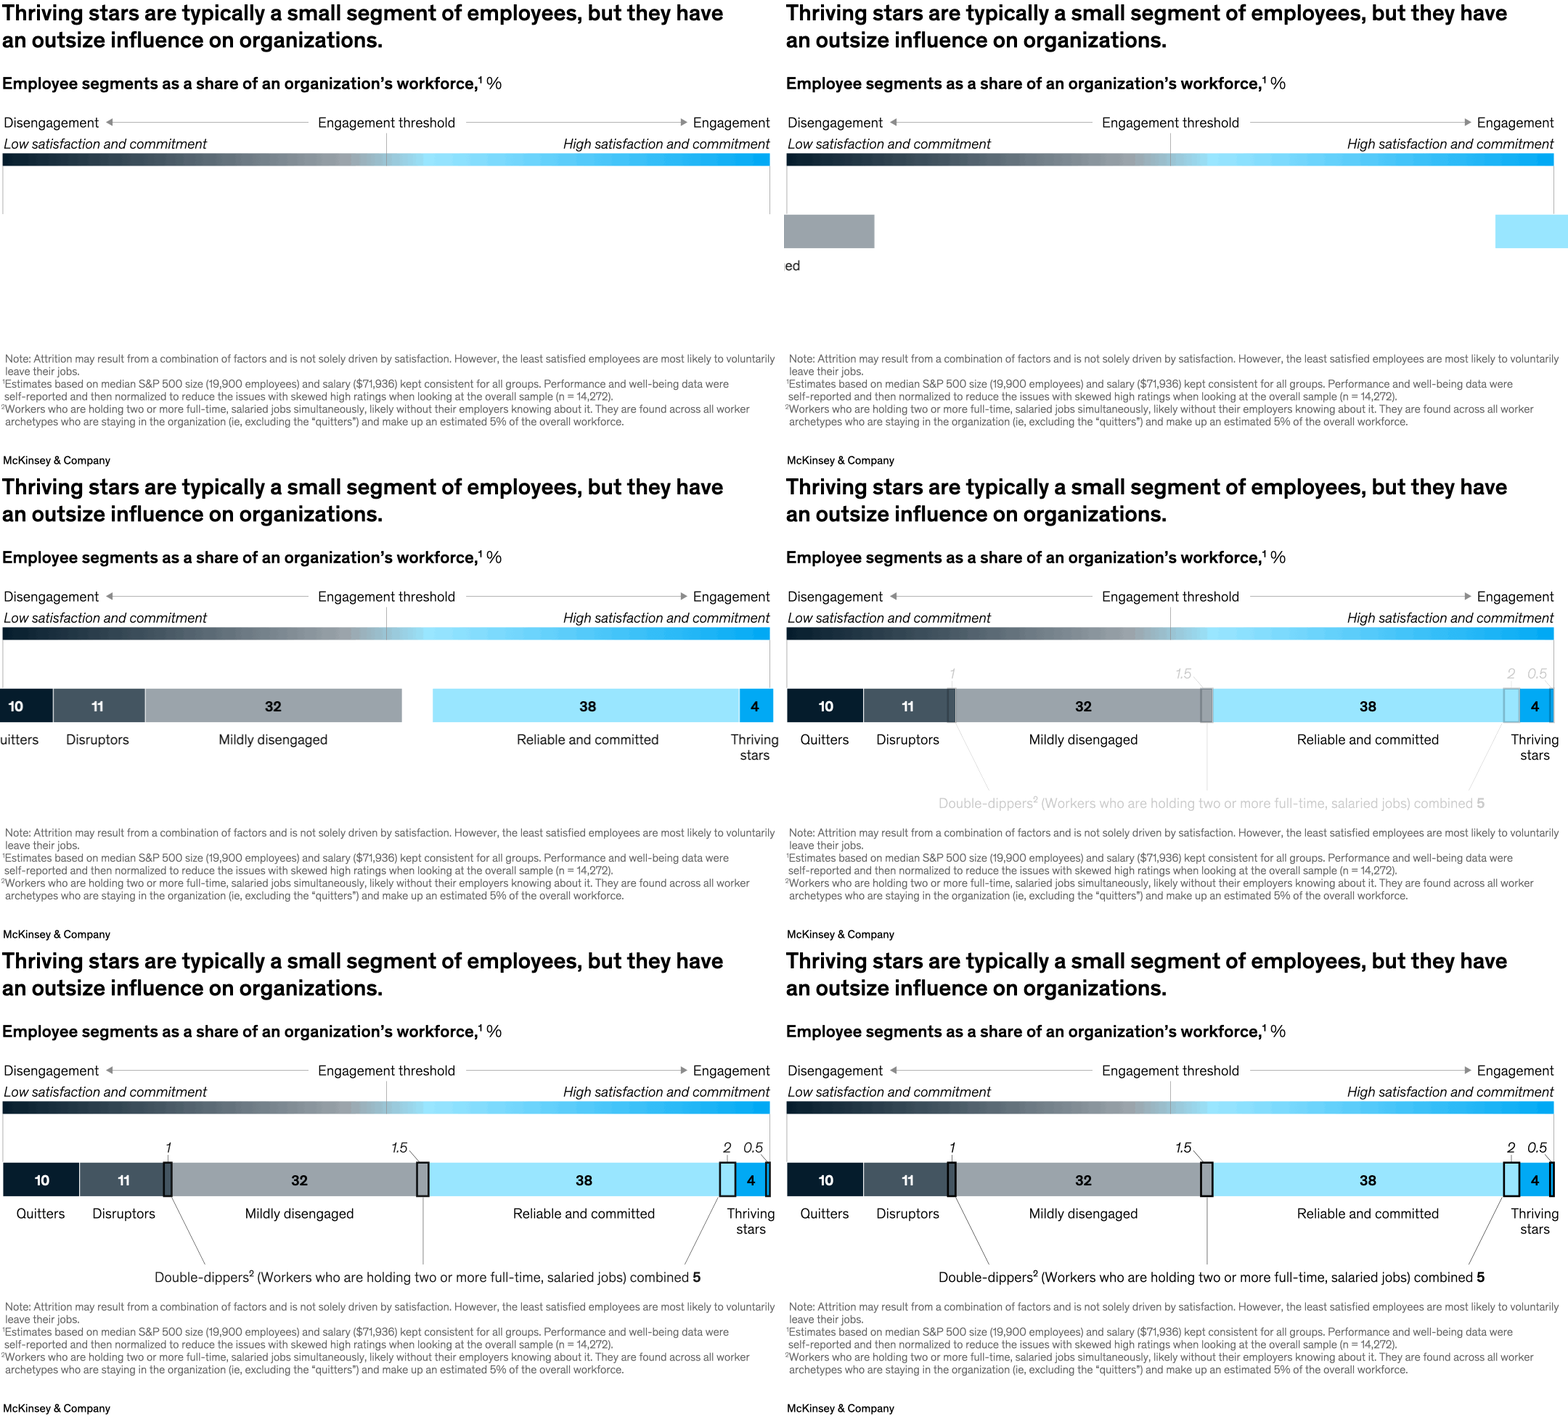
May 29, 2024 – In categorizing employees based on their level of satisfaction, thriving stars—those who are most engaged—comprise only about 4 percent of a typical organization. Yet, note senior partners Aaron De Smet and Brooke Weddle and colleagues, these thriving workers have an outsize positive impact on their organizations and their influence has the potential to grow as generative AI becomes more prevalent. Thriving is a state that applies across industries, from educators and healthcare specialists to data engineers and retail associates.
To read the article, see “To defend against disruption, build a thriving workforce,” May 8, 2024.
customizer here
Visual form
Bar chart.
Layout / body structure
The chart is a single horizontal distribution bar broken into employee segments from left to right. The reading order runs from quitters on the far left through disruptors, mildly disengaged, reliable and committed, and finally thriving stars on the far right.
What is being compared
It compares employee segments as a share of an organization’s workforce, separating disengaged and low-commitment workers from more engaged and committed groups.
Measurement system
Each segment is shown as a percentage of the workforce. The values are printed directly inside or above the blocks, and a gradient header above the bar runs from disengagement on the left to engagement on the right.
Visible structure inside the graphic
One long segmented bar carries five labeled blocks, with narrower categories at the ends and larger middle categories taking most of the width. A threshold mark sits above the right side of the bar to separate the small thriving-stars segment from the much larger reliable-and-committed block.
Main takeaway from the visual
The chart shows that thriving stars are only a tiny slice of the workforce, while mildly disengaged and reliable-and-committed employees make up most of the organization, which is why even a small high-performing segment can have outsized influence.
Key standout values or extremes
The largest block is reliable and committed at 38 percent, followed by mildly disengaged at 32 percent. Quitters and disruptors are much smaller at 10 percent and 11 percent, and thriving stars are the smallest visible segment at 4 percent.
Controls / sequence, when applicable
This is a static chart image with no in-chart controls to operate.
Companion media, when applicable
There is no separate companion audio or video; the chart image is the full visual on this page.