Source page: McKinsey & Company
Commentary
The reel deal for Asians and Pacific Islanders
Diversity & Inclusion | Entertainment
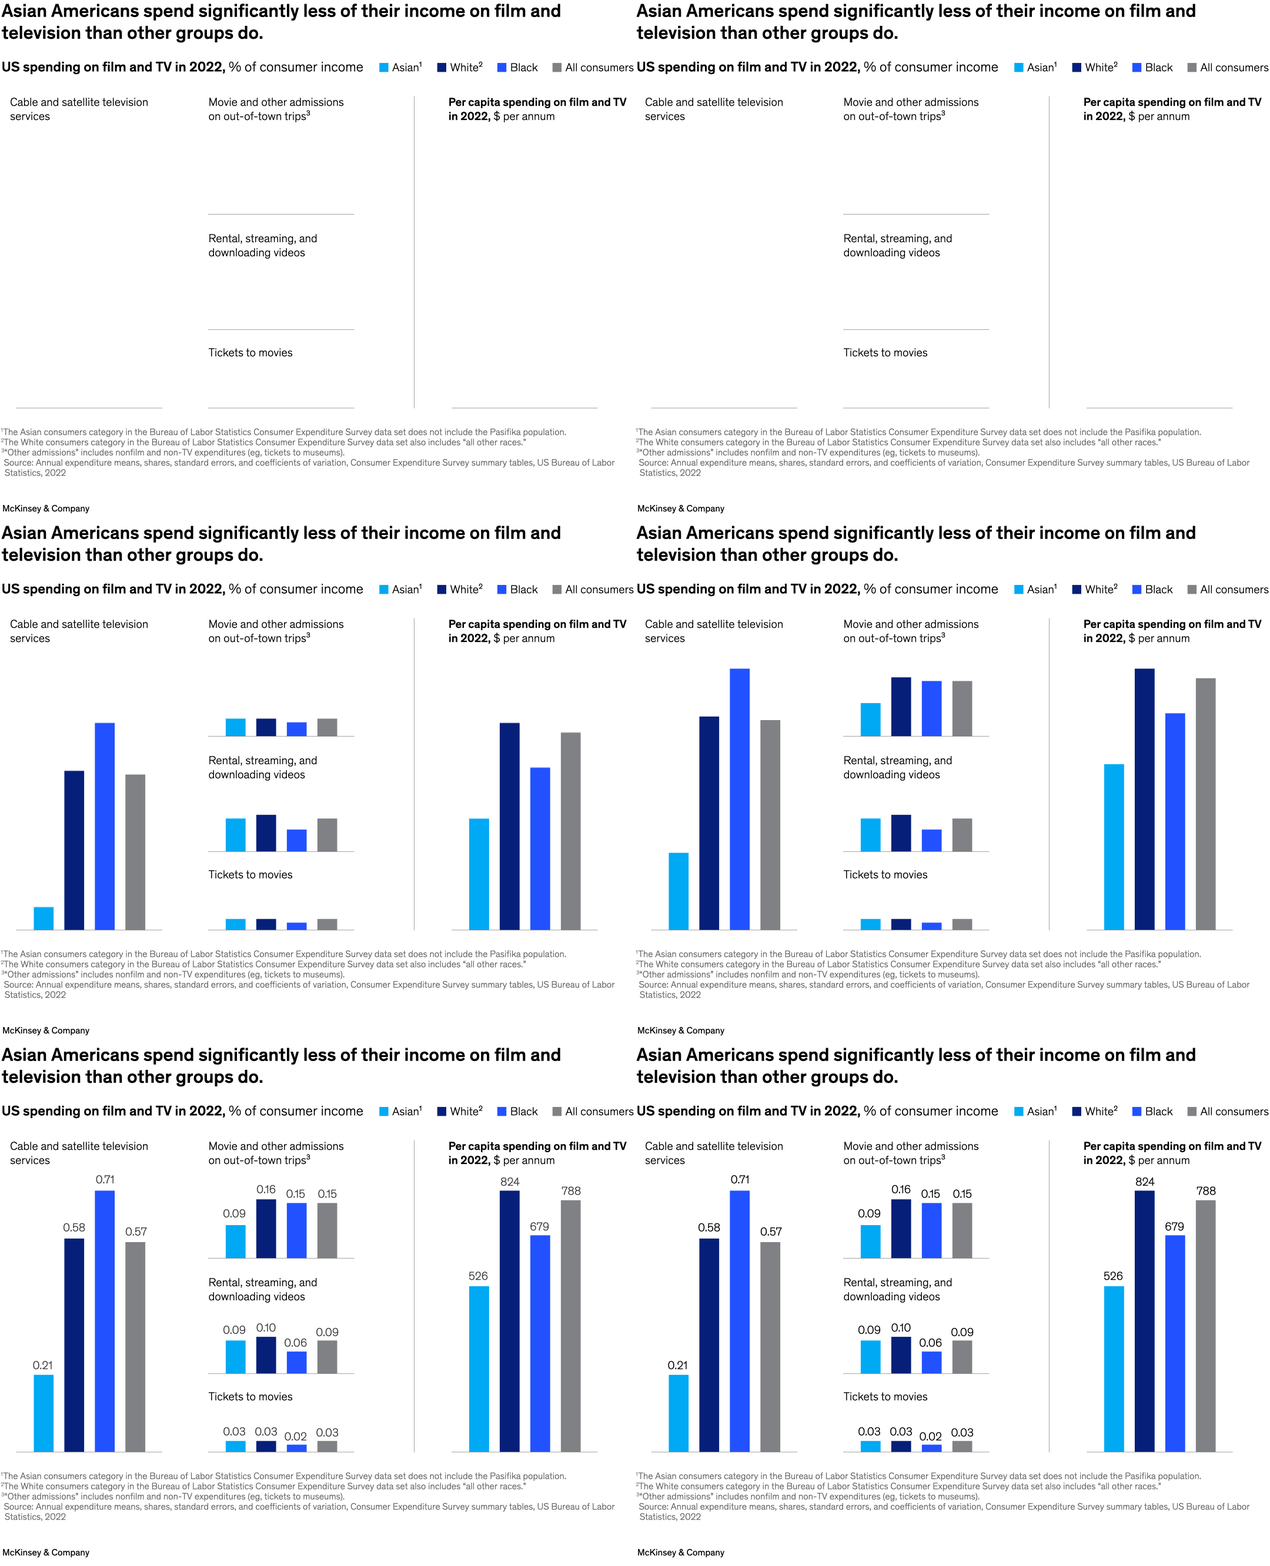
May 17, 2024 – The film and television industry has the opportunity to unlock billions of dollars in additional revenue by improving how Asian and Pacific Islanders (APIs) are represented, according to senior partner Kabir Ahuja and colleagues. Asian Americans, for example, spend only about 0.4 percent of their income on entertainment, while White and Black consumers spend about 0.9 percent. And half of API respondents to a McKinsey survey said they’d spend more if their experiences were portrayed authentically.
To read the report, see “From margins to mainstream: Asians and Pacific Islanders in Hollywood,” April 24, 2024.
customizer here
Visual form
Multi-panel bar chart.
Layout / body structure
The page combines several small category charts on the left and center with one larger per-capita-spending chart on the right. The reading order moves from the cable-and-satellite comparison to admissions, rental and streaming, tickets, and then to the taller annual-spending bars on the right.
What is being compared
It compares film and television spending across consumer groups, especially Asian, White, Black, and all consumers, across service categories and annual per-capita totals.
Measurement system
The small panels use percentage of consumer income, while the rightmost panel uses dollars per annum. Color separates the consumer groups, and the numeric labels above the bars provide the exact values.
Visible structure inside the graphic
One tall grouped bar chart for cable and satellite sits on the left, three smaller grouped charts for movie and other admissions, rental-streaming-downloading videos, and tickets to movies sit in the center, and a tall grouped bar chart for annual per-capita spending sits on the right.
Main takeaway from the visual
The chart shows that Asian Americans devote a smaller share of income to film and TV spending than the comparison groups do, and that lower share also shows up in the annual spending total on the right.
Key standout values or extremes
In cable and satellite, the Asian bar is 0.21 percent of income versus 0.58 for White consumers and 0.71 for Black consumers. On annual spending, Asians are at $526 per year versus $824 for White consumers, $679 for Black consumers, and $788 for all consumers.
Controls / sequence, when applicable
This is a static chart image with no in-chart controls to operate.
Companion media, when applicable
There is no separate companion audio or video; the chart image is the full visual on this page.