Source page: McKinsey & Company
Commentary
A new energy strategy
Decarbonization | Industrials & Electronics
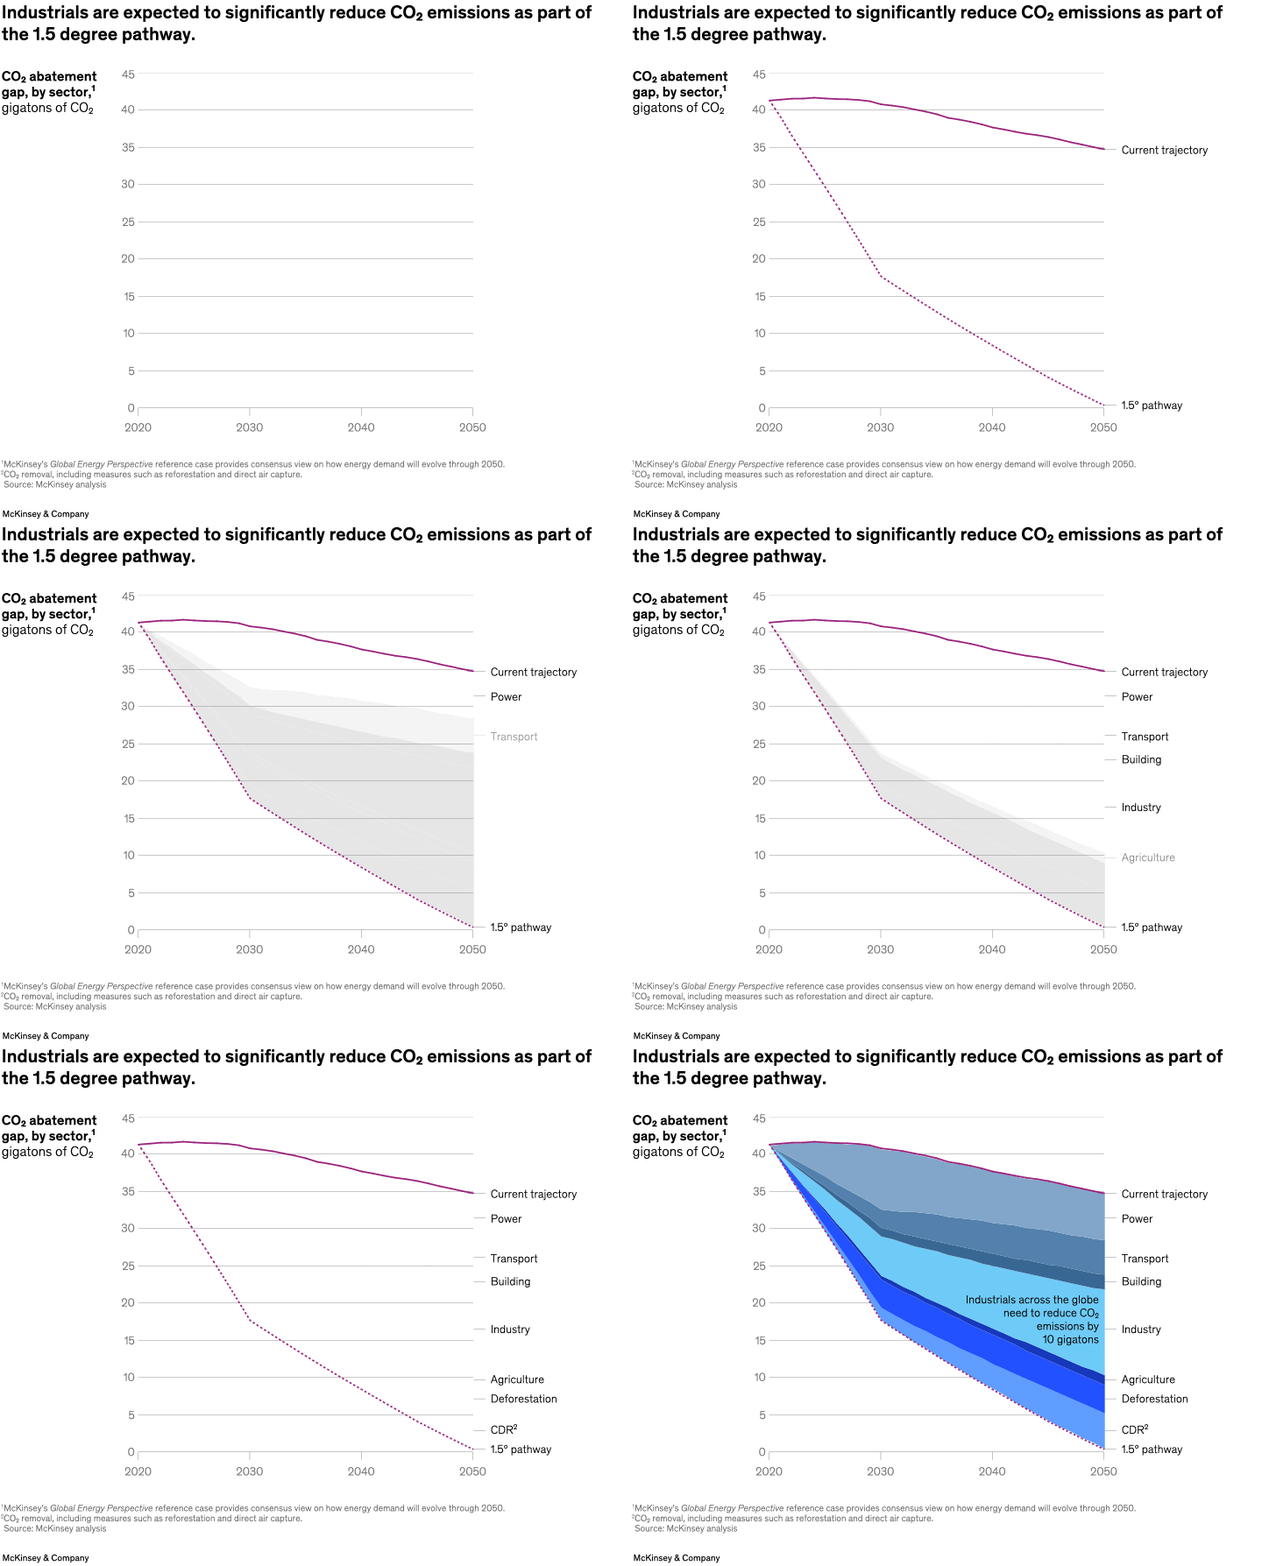
April 30, 2024 – Industrials are highly exposed to rising energy costs and the recent volatility in prices caused by geopolitical instability. At the same time, many companies in the sector have set ambitious decarbonization targets for the coming decade that require them to reduce CO2 emissions by 10 gigatons. Senior partners Mauro Erriquez and Humayun Tai and coauthors find that many industrials still need to develop the energy strategy (including tools, capabilities, and governance) to meet their targets and put them on a pathway that could limit global warming to 1.5°C above preindustrial levels.
To read the article, see “Playing offense: Industrials staying ahead in the energy transition,” April 3, 2024.
customizer here
Visual form
Area chart.
Layout / body structure
This is a single layered area chart running from 2020 to 2050, with sector labels aligned along the right edge. The reading order is left to right through time and then down the stacked sector bands on the right.
What is being compared
It compares the CO2 abatement gap across sectors under the 1.5-degree pathway, including power, transport, buildings, industry, agriculture, deforestation, and carbon-dioxide removal.
Measurement system
The y-axis is gigatons of CO2 and the x-axis is time from 2020 to 2050. The stacked colored bands show how much abatement each sector contributes, while the current-trajectory line remains above the deeper pathway cut through the middle of the chart.
Visible structure inside the graphic
Multiple colored area bands stack downward from the current trajectory toward the 1.5-degree pathway. The largest middle bands belong to industrial sectors, and a callout inside the chart highlights the remaining emissions burden that industry still needs to cut.
Main takeaway from the visual
The chart shows that industry remains one of the biggest unresolved pieces of the emissions challenge even as total emissions decline, so a credible energy strategy needs large industrial abatement rather than relying only on power or transport.
Key standout values or extremes
The callout in the middle of the chart notes that industrials across the globe need to reduce CO2 emissions by about 10 gigatons. By 2050 the lower pathway converges close to zero, while the current trajectory remains much higher across the whole period.
Controls / sequence, when applicable
This is a static chart image with no in-chart controls to operate.
Companion media, when applicable
There is no separate companion audio or video; the chart image is the full visual on this page.