Source page: McKinsey & Company
Commentary
The real deal with real estate deals
Private equity | Real estate
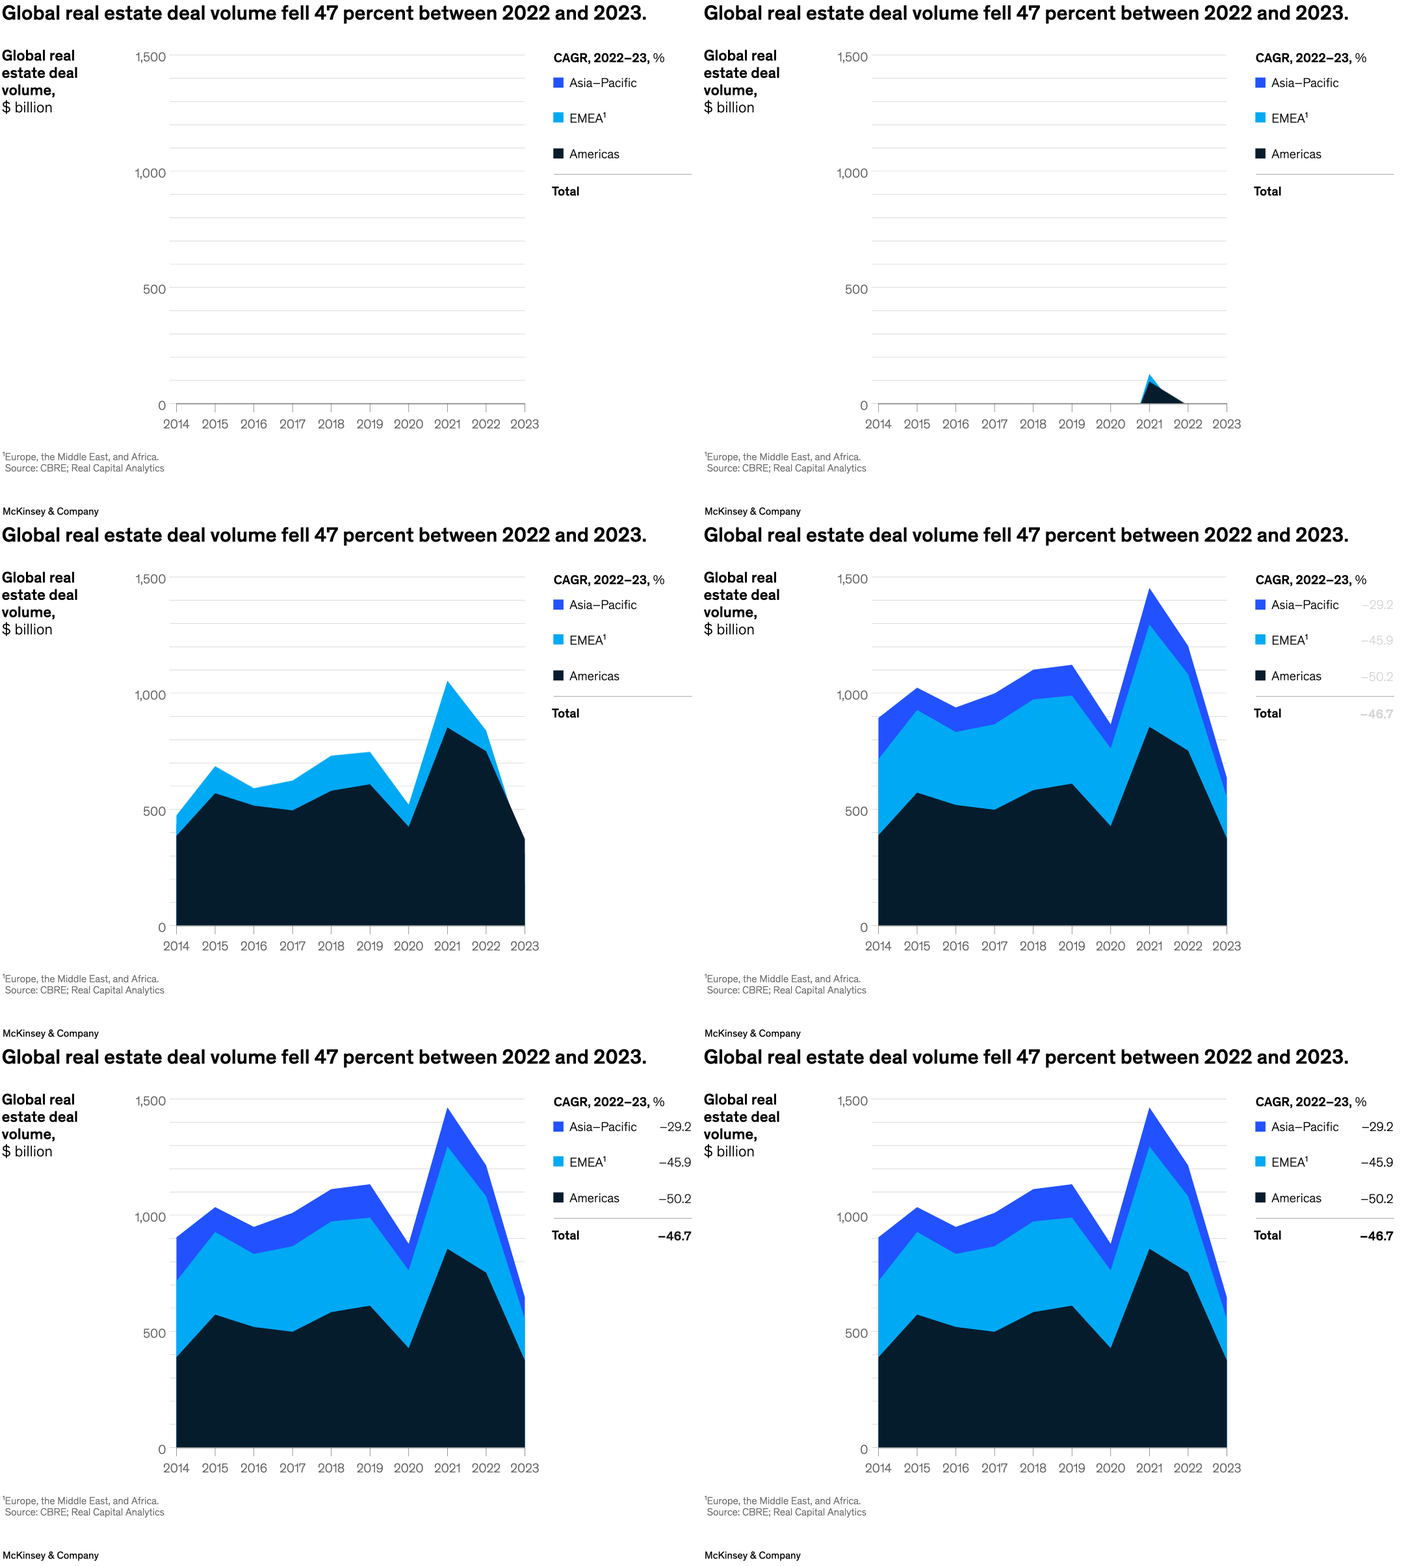
April 29, 2024 – Real estate deal activity plunged below historical averages in 2023. Pandemic-related demand uncertainty, declining rent growth, and elevated financing costs drove up capitalization rates and weighed down deal volume, say senior partners Alastair Green and Aditya Sanghvi and coauthors. Global real estate deal volume hit a ten-year low after plummeting 47 percent from 2022 levels to $650 billion.
To read the report, see “McKinsey Global Private Markets Review 2024: Private markets in a slower era,” March 28, 2024.
customizer here
Visual form
Area chart.
Layout / body structure
The page uses a single stacked area chart over time, with a CAGR legend on the right. The reading order is left to right from 2014 to 2023 and then into the right-side legend that summarizes the regional decline rates.
What is being compared
It compares global real estate deal volume over time and breaks the total into Asia-Pacific, EMEA, and the Americas.
Measurement system
The y-axis is global real estate deal volume in billions of dollars and the x-axis is year. The stacked areas show regional contribution to the total, while the legend lists the 2022 to 2023 CAGR for each region and for the total market.
Visible structure inside the graphic
Three colored layers stack to form the total volume line, with the darkest base for the Americas and lighter layers for the other regions above it. The chart peaks sharply in 2021 before falling into 2022 and again into 2023.
Main takeaway from the visual
The chart shows a broad-based collapse in deal activity after the 2021 peak, with all three regions shrinking sharply rather than one region alone dragging the total down.
Key standout values or extremes
The total decline from 2022 to 2023 is shown at 46.7 percent. EMEA is down 45.9 percent, the Americas 50.2 percent, and Asia-Pacific 29.2 percent, while the overall chart falls from well above $1 trillion in 2021 to far lower levels by 2023.
Controls / sequence, when applicable
This is a static chart image with no in-chart controls to operate.
Companion media, when applicable
There is no separate companion audio or video; the chart image is the full visual on this page.