Source page: McKinsey & Company
Commentary
A gen AI risk assessment
Generative AI | Risk
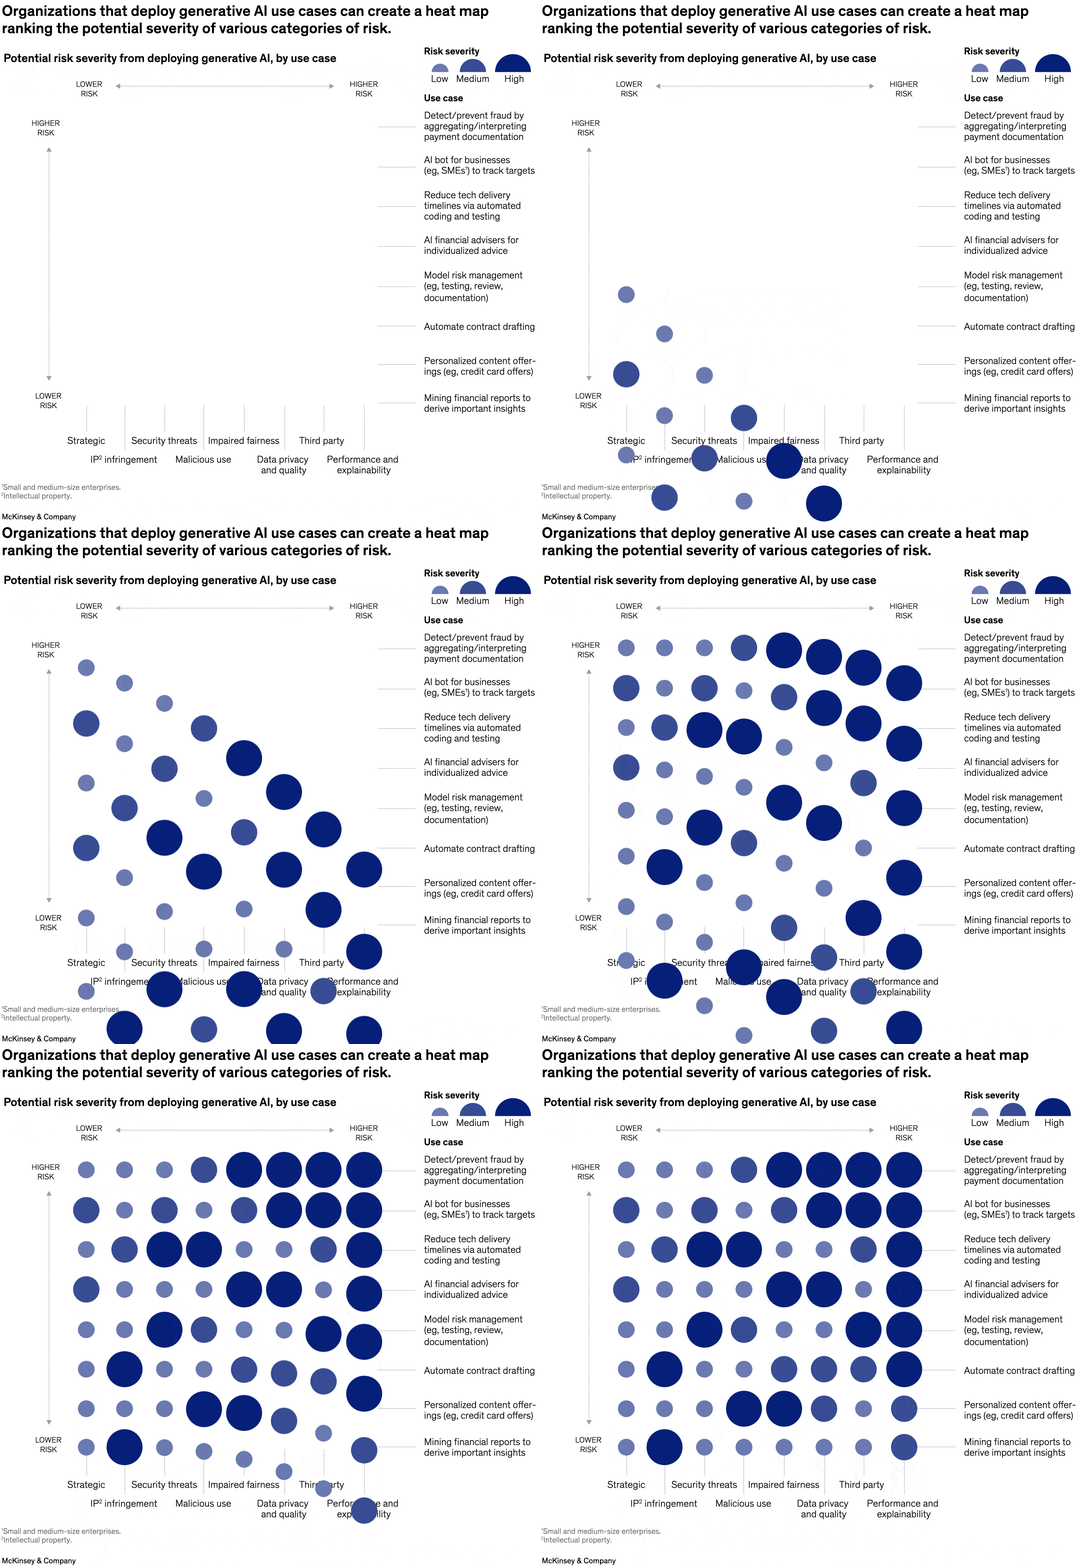
April 10, 2024 – Which generative AI opportunities should organizations pursue? A good starting point may be to map out potential risks associated with use cases in specific categories, senior partner Lareina Yee and coauthors explain. Use cases involving customer care, for example, such as chatbots powered by generative AI, could increase risk related to bias or could produce inaccurate answers due to outdated information.
To read the article, see “Implementing generative AI with speed and safety,” March 13, 2024.
customizer here
Visual form
Bubble chart.
Layout / body structure
The chart is a single matrix-style risk map with use cases listed down the right side and risk categories running along the bottom. The reading order moves across the risk categories and then down through the use cases, using bubble size and shading to interpret severity.
What is being compared
It compares the potential severity of different categories of risk for a range of generative AI use cases.
Measurement system
The matrix uses an ordinal heat-map logic rather than a numeric axis. The vertical dimension runs from lower risk to higher risk, and the bubbles vary in size and darkness to show relative severity within each cell.
Visible structure inside the graphic
Rows represent use cases such as document fraud, fraud prevention augmentation, marketing and personalization, contract drafting, and financial-report analysis. Columns represent risk categories including strategic, security threats, impaired fairness, data privacy and quality, third-party, and performance and explainability.
Main takeaway from the visual
The chart shows that risk is not concentrated in one single bucket; different use cases create different hot spots, with especially heavy concentrations in privacy, performance, and third-party or explainability-related risk areas.
Key standout values or extremes
The largest and darkest bubbles cluster in the right-hand side of the grid, particularly for use cases tied to data-rich automation and customer-facing or decision-support workflows, while a smaller set of cells on the left side remains comparatively light.
Controls / sequence, when applicable
This is a static chart image with no in-chart controls to operate.
Companion media, when applicable
There is no separate companion audio or video; the chart image is the full visual on this page.