Source page: McKinsey & Company
Commentary
A feel-good story for the economy
Workplace | Healthcare | Work-life balance
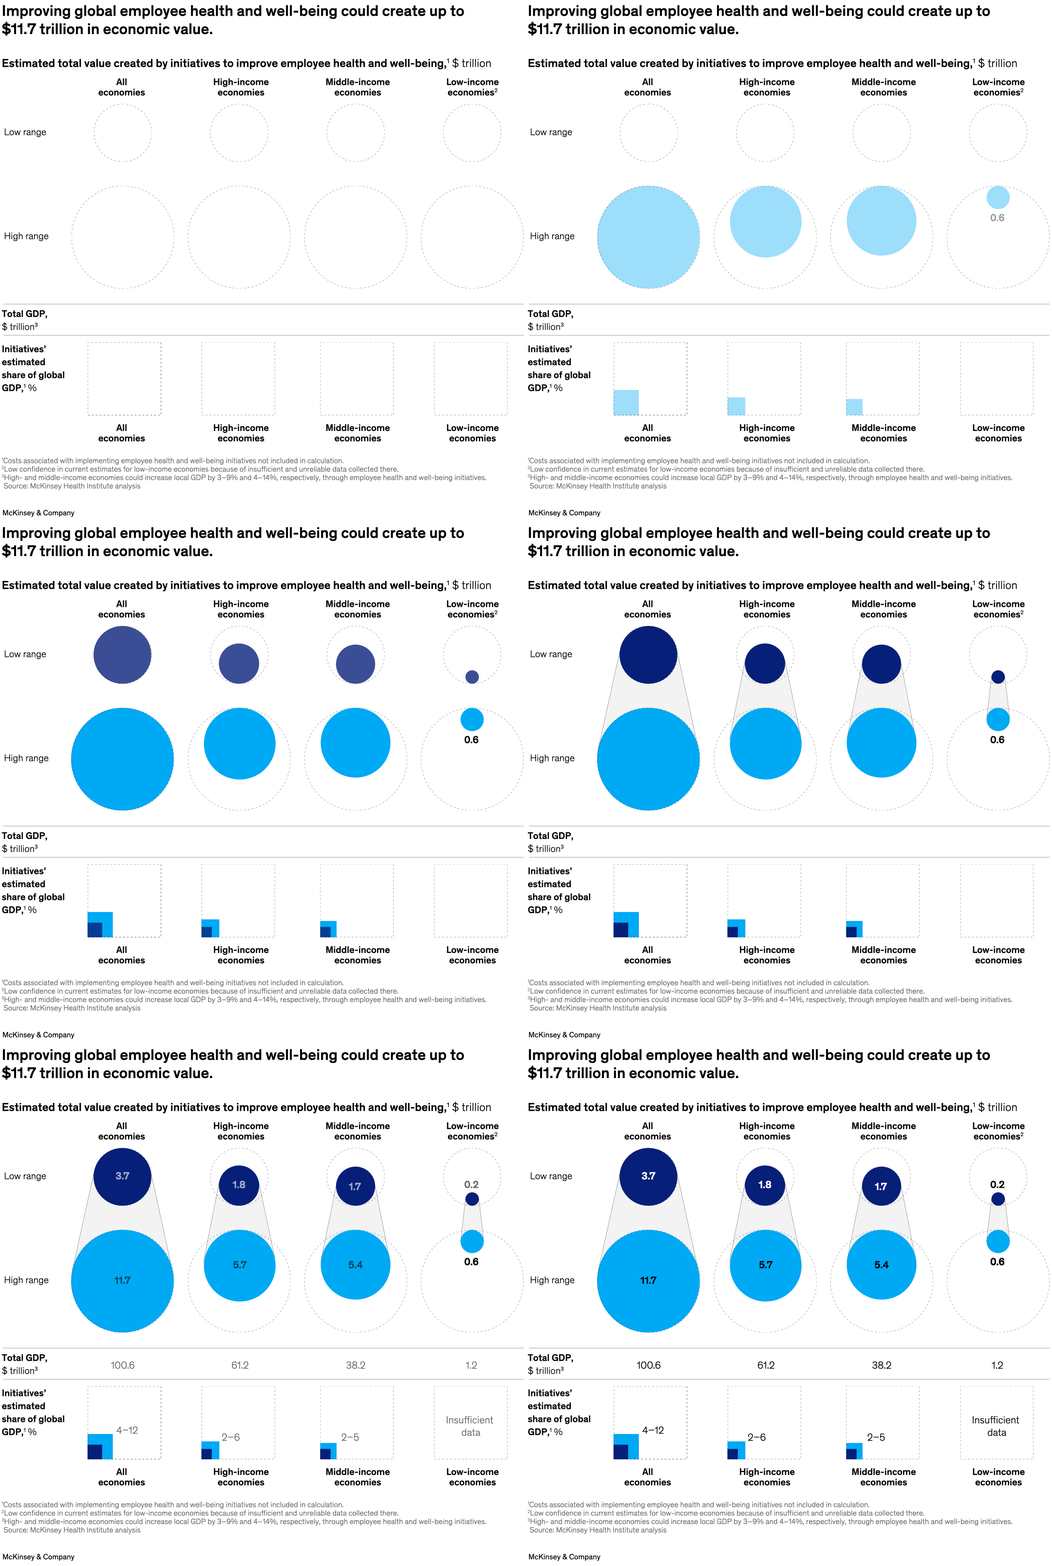
April 9, 2024 – There’s a potential payoff from happier, healthier employees. According to senior partner Patrick Simon and colleagues, improving employee health and well-being could create $3.7 trillion to $11.7 trillion in economic value—the equivalent of raising global GDP by 4 to 12 percent. Employers could look to six key areas for boosting employee health: social interaction, mindsets and beliefs, productive activity, stress, economic security, and sleep.
To read the article, see “Working nine to thrive,” March 13, 2024.
customizer here
Visual form
Comparison infographic.
Layout / body structure
The page combines a row of value circles at the top with supporting GDP and initiative-share blocks below. The reading order is left to right across the four income-group columns and then downward into the smaller comparison strip underneath.
What is being compared
It compares the economic value that could come from improving employee health and well-being across all economies, high-income economies, middle-income economies, and low-income economies.
Measurement system
The values are trillions of dollars for the value circles and percentages for the initiative-share strip below. Each column shows a low-range and high-range circle, with the larger lower circle representing the high estimate.
Visible structure inside the graphic
Each income group has two stacked circles, a smaller dark one for the low range and a larger bright one for the high range. Beneath them, small blocks show the share of GDP represented by the estimated impact in each income group.
Main takeaway from the visual
The visual shows that improving health and well-being has very large economic upside across the whole world, with the highest absolute gains concentrated in the broad all-economies total and the largest income-group contributions coming from higher- and middle-income economies.
Key standout values or extremes
The all-economies column ranges from 3.7 trillion to 11.7 trillion dollars. High-income economies range from 1.8 to 5.7 trillion, middle-income economies from 1.7 to 5.4 trillion, and low-income economies from 0.2 to 0.6 trillion.
Controls / sequence, when applicable
This is a static chart image with no in-chart controls to operate.
Companion media, when applicable
There is no separate companion audio or video; the chart image is the full visual on this page.