Source page: McKinsey & Company
Commentary
Making smart calls on 6G
Telecommunications | Technology
April 2, 2024 – 6G has the potential to revolutionize the mobile industry. However, new technology doesn’t always mean better value for telcos, find senior partners Tomás Lajous and Martin Wrulich and coauthors. Based on previous generations of mobile tech, spending growth has tended to outpace revenue growth for mobile network operators, for example. To realize the economic potential of 6G, players in the telecommunications industry could consider a set of actions, including expanding the roster of network investors and making smart investments in digital infrastructure.
To read the report, see “Shaping the future of 6G,” February 28, 2024.
customizer here
Visual form
Bar chart.
Layout / body structure
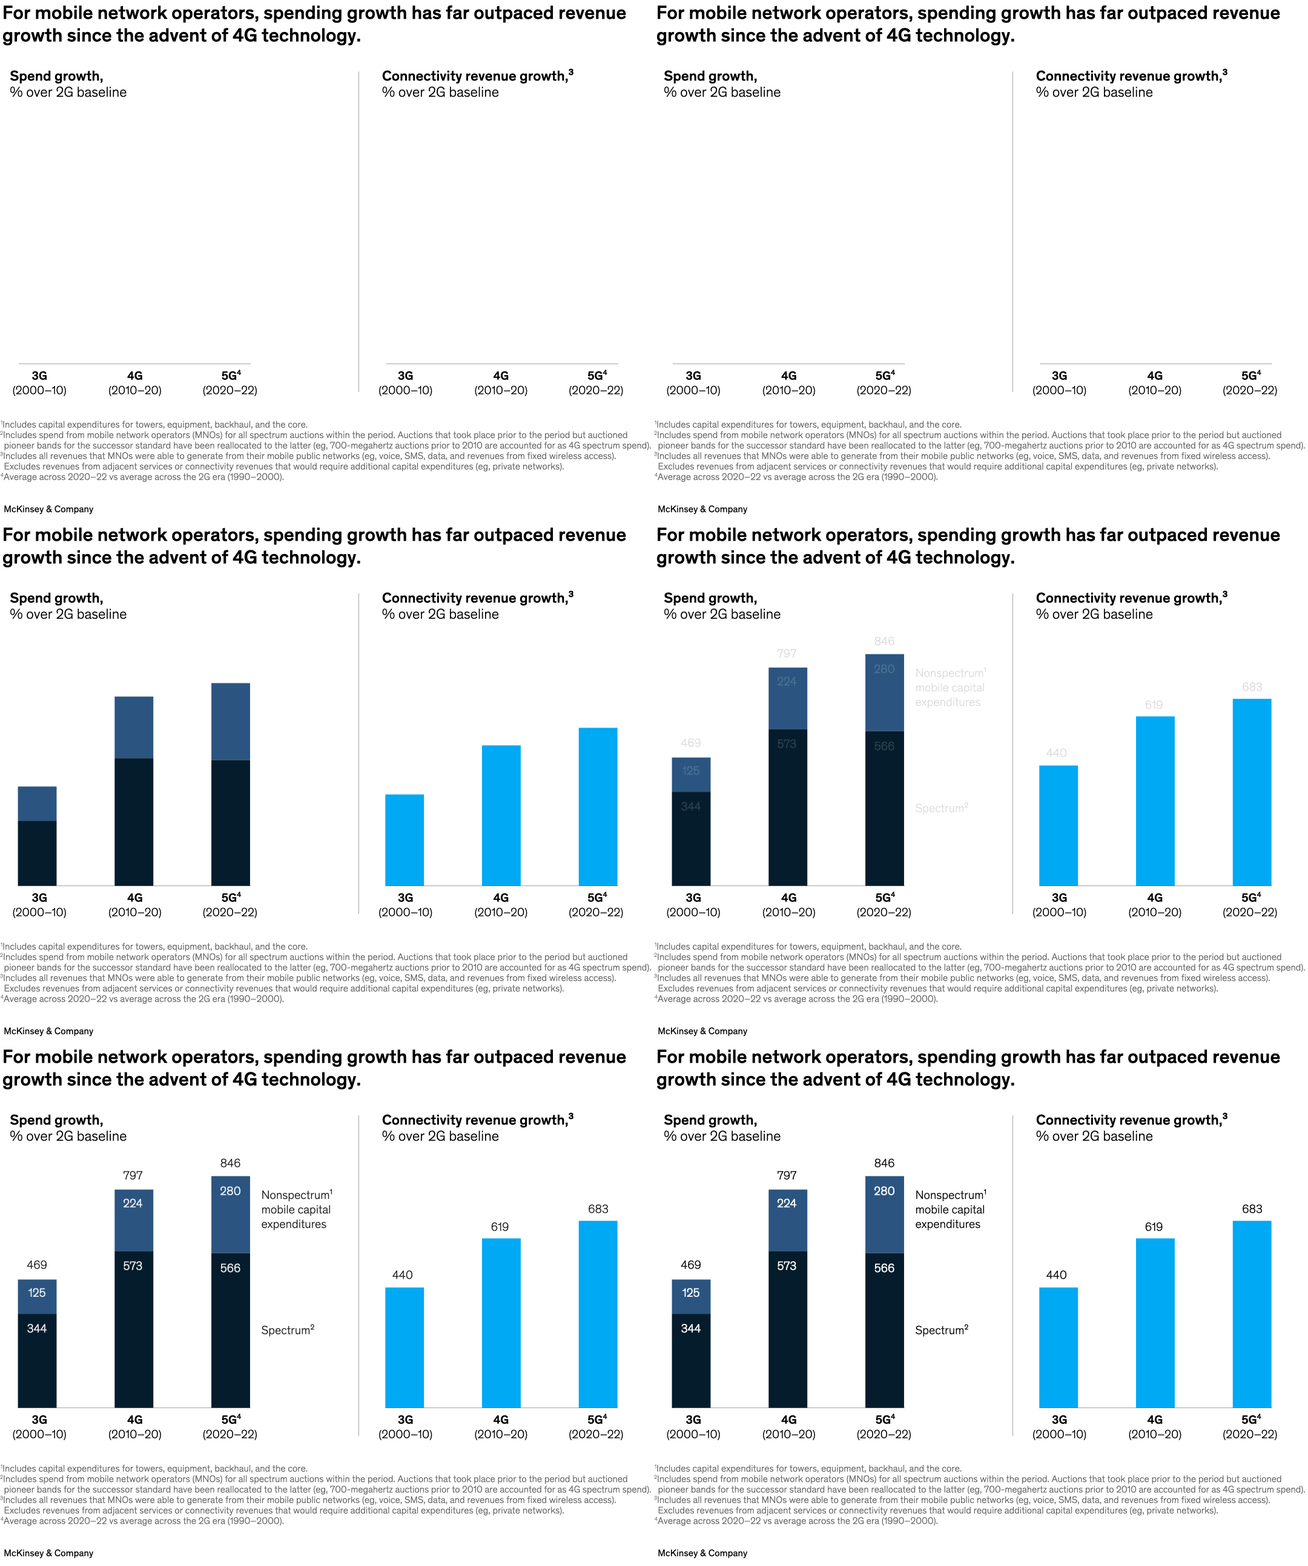
The chart is split into two side-by-side bar-chart panels. The left panel shows spend growth for 3G, 4G, and 5G, and the right panel shows connectivity revenue growth for the same technology generations, so the reading order is left panel first and right panel second.
What is being compared
It compares how much mobile-network-operator spending has grown across technology generations relative to how much connectivity revenue has grown over the same baselines.
Measurement system
Both panels are measured as percentages over the prior generation’s baseline. The left panel stacks or segments the spending bars to show spectrum and non-spectrum capital expenditures, while the right panel uses simple vertical bars for revenue growth.
Visible structure inside the graphic
The left panel contains three dark-to-light bars labeled for 3G, 4G, and 5G, with internal segment labels for spectrum and non-spectrum spend. The right panel mirrors the same three categories with tall bright-blue bars showing revenue growth.
Main takeaway from the visual
The chart shows that spending growth has consistently outpaced revenue growth as network generations advanced, which is the core tension behind the 6G investment decision.
Key standout values or extremes
Spend growth rises from 469 percent for 3G to 797 percent for 4G and 846 percent for 5G, while connectivity revenue growth is lower at 440 percent, 619 percent, and 683 percent across the same technology eras.
Controls / sequence, when applicable
This is a static chart image with no in-chart controls to operate.
Companion media, when applicable
There is no separate companion audio or video; the chart image is the full visual on this page.