Source page: McKinsey & Company
Commentary
Overpowered
Electric power and natural gas | Renewable energy
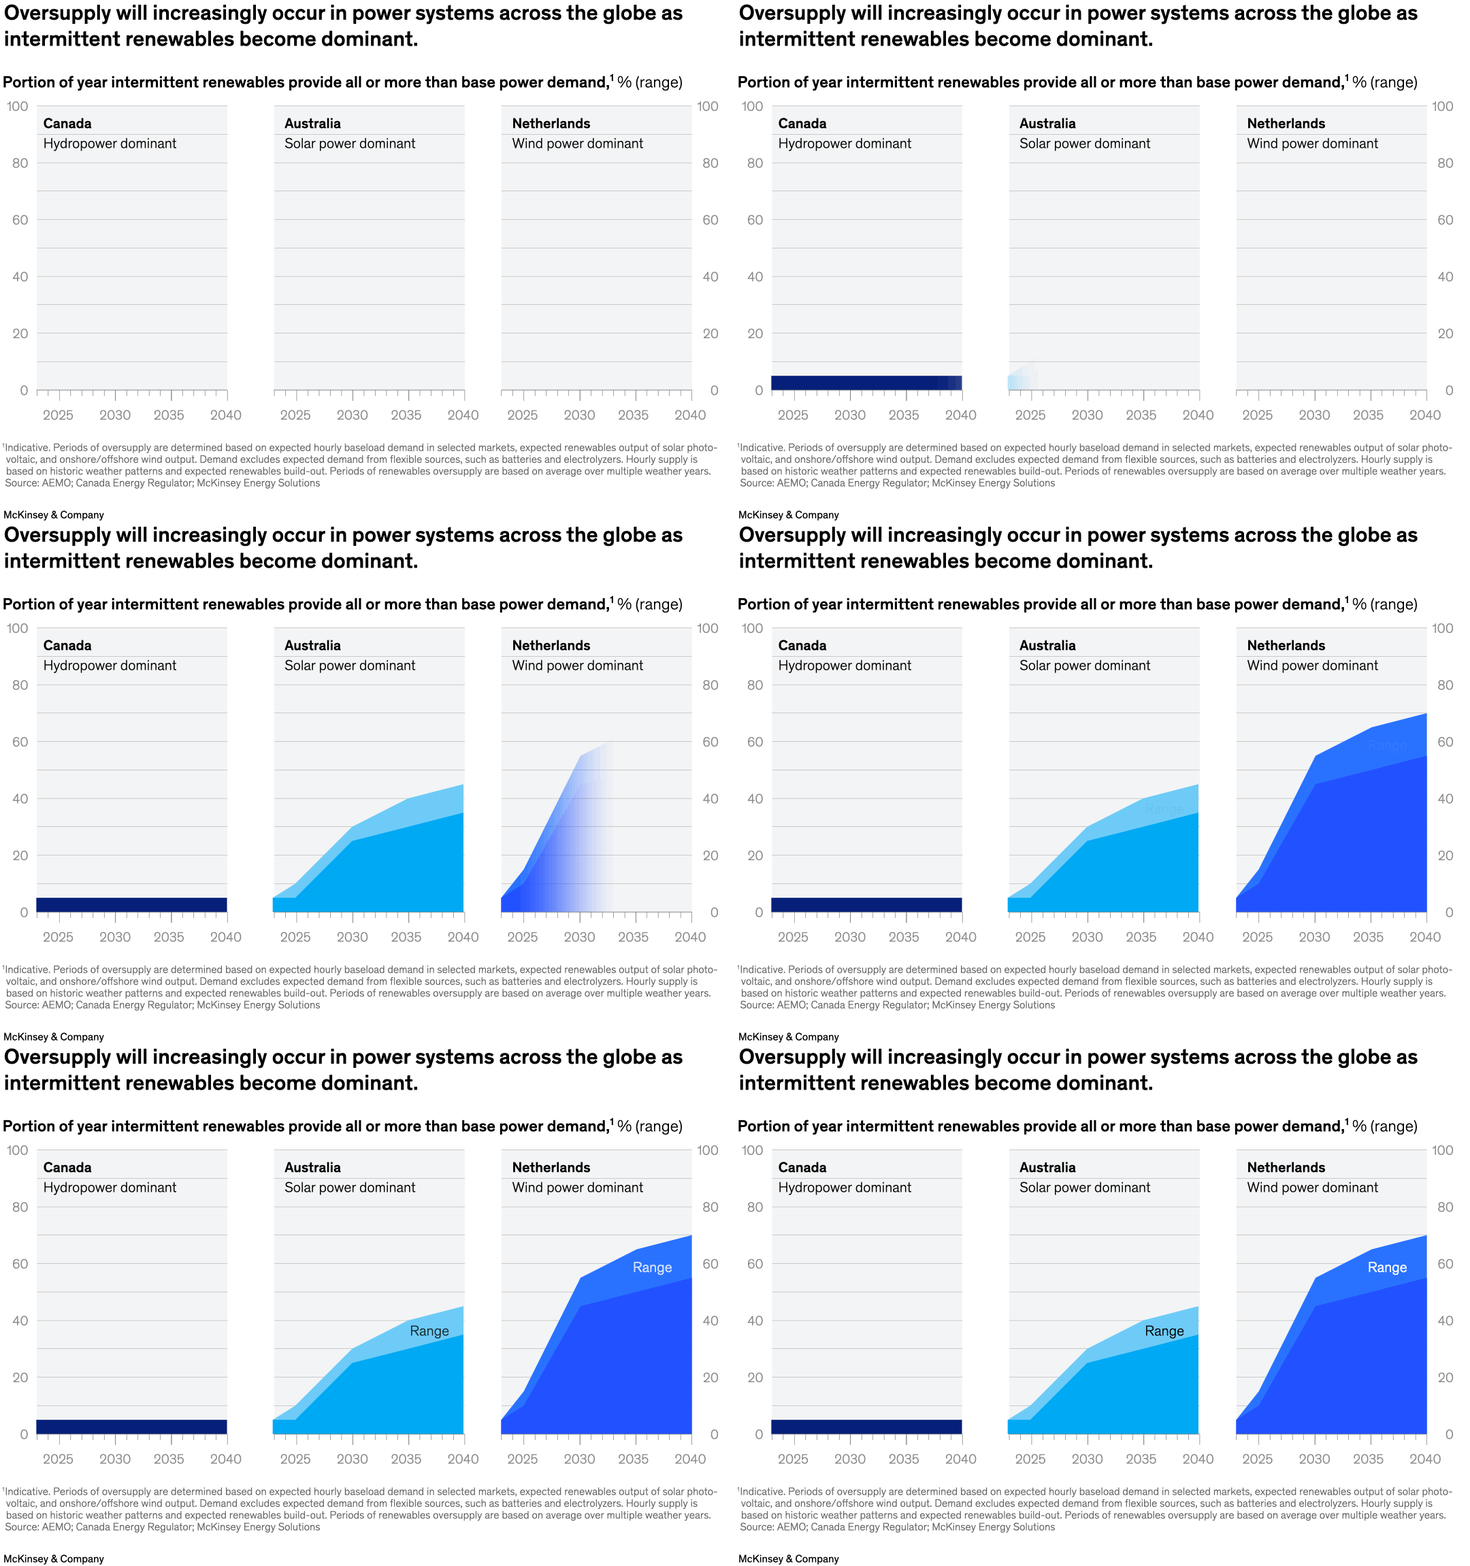
March 28, 2024 – As wind and solar power scale, there could be moments when electricity supply outpaces demand in certain markets. According to partner Godart van Gendt and colleagues, parts of Australia could see peaks in solar electricity that meet or exceed baseload demand for approximately a third of the time by 2030. Finding ways to use the available oversupply, such as storing it or using it to produce green hydrogen, could help accelerate the energy transition—and have an economic upside. Our analysis shows that using this oversupply of electricity in the European Union, for example, could create €7 billion to €14 billion of value annually.
To read the article, see “Demand-based pricing stabilizes the electricity market of the future,” February 28, 2024.
customizer here
Visual form
Multi-panel area chart.
Layout / body structure
The page is arranged as three regional small-multiple panels for Canada, Australia, and the Netherlands. Read left to right through the three panels, following each colored band forward from the late 2020s toward 2040.
What is being compared
It compares the portion of the year when intermittent renewables provide all or more than base-power demand under different power-system profiles.
Measurement system
The y-axis in each panel is percentage of the year, and the x-axis runs over time toward 2040. The shaded range bands indicate the expected oversupply window for each power system.
Visible structure inside the graphic
Each country panel contains a rising colored area or band that widens over time. Canada stays near the bottom with only a small rise, while Australia and especially the Netherlands show much larger bands that climb into the middle and upper portions of the chart.
Main takeaway from the visual
The visual shows that oversupply from intermittent renewables becomes much more common as these sources dominate the power mix, but the size of that oversupply varies sharply by system type.
Key standout values or extremes
Canada remains close to the bottom of the scale through the period, Australia rises into roughly the 20 to 40 percent range by the end, and the Netherlands climbs highest, with the range reaching well above 50 percent by the late 2030s.
Controls / sequence, when applicable
This is a static chart image with no in-chart controls to operate.
Companion media, when applicable
There is no separate companion audio or video; the chart image is the full visual on this page.