Source page: McKinsey & Company
Commentary
Europe's untapped resource
Europe | Diversity & Inclusion
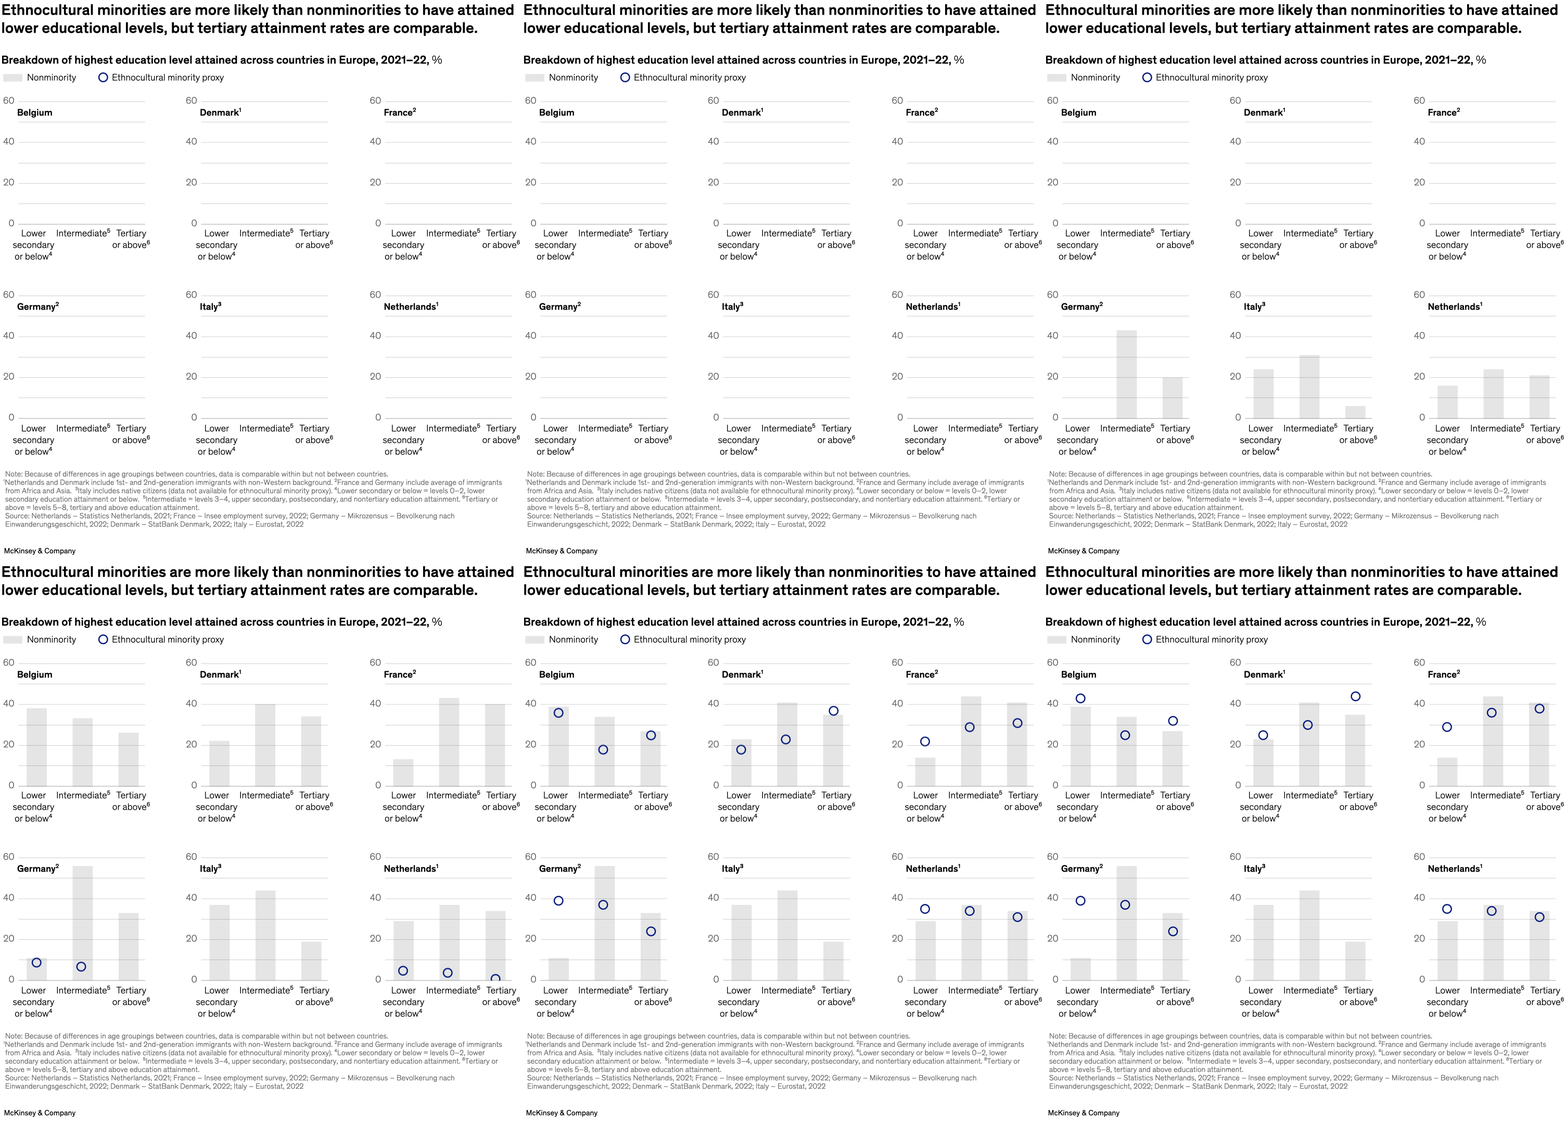
March 13, 2024 – As economies slow and labor markets become tighter, Europe has an opportunity to increase the economic empowerment of ethnocultural minorities while boosting growth. Senior partner Tunde Olanrewaju and colleagues find that one obstacle standing in the way of unlocking the economic potential of ethnocultural minorities stems from a common misperception that they lack the necessary skills to be qualified job candidates. In fact, ethnocultural minorities tend to outperform nonminorities at the lower educational levels and show comparable achievement at the tertiary level.
To read the report, see “Ethnocultural minorities in Europe: A potential triple win,” February 8, 2024.
customizer here
Visual form
Multi-panel dot chart.
Layout / body structure
The page is arranged as a grid of country panels, each with three education levels. The reading order is across the country panels and within each panel from lower secondary or below to intermediate to tertiary or above.
What is being compared
It compares educational attainment for ethnocultural minorities versus nonminorities across European countries.
Measurement system
The y-axis is percentage share, and each education tier within a panel has paired marks for the two population groups. The chart distinguishes nonminority and ethnocultural-minority attainment with different point or bar markers.
Visible structure inside the graphic
Each country panel contains a small three-position chart with category labels beneath it. The paired markers show where minorities and nonminorities diverge at lower education levels and where they converge more closely at tertiary attainment.
Main takeaway from the visual
The visual shows that ethnocultural minorities are overrepresented at lower educational levels in several countries, but the gap narrows sharply at tertiary attainment, where minority and nonminority rates often look much closer.
Key standout values or extremes
Across the panels, the most visible separation tends to occur in the lower-secondary-or-below category, while the tertiary-or-above markers are often near each other, including in panels such as Germany, the Netherlands, and France.
Controls / sequence, when applicable
This is a static chart image with no in-chart controls to operate.
Companion media, when applicable
There is no separate companion audio or video; the chart image is the full visual on this page.