Source page: McKinsey & Company
Commentary
Navigating global trade flows
Global Trade | Economy
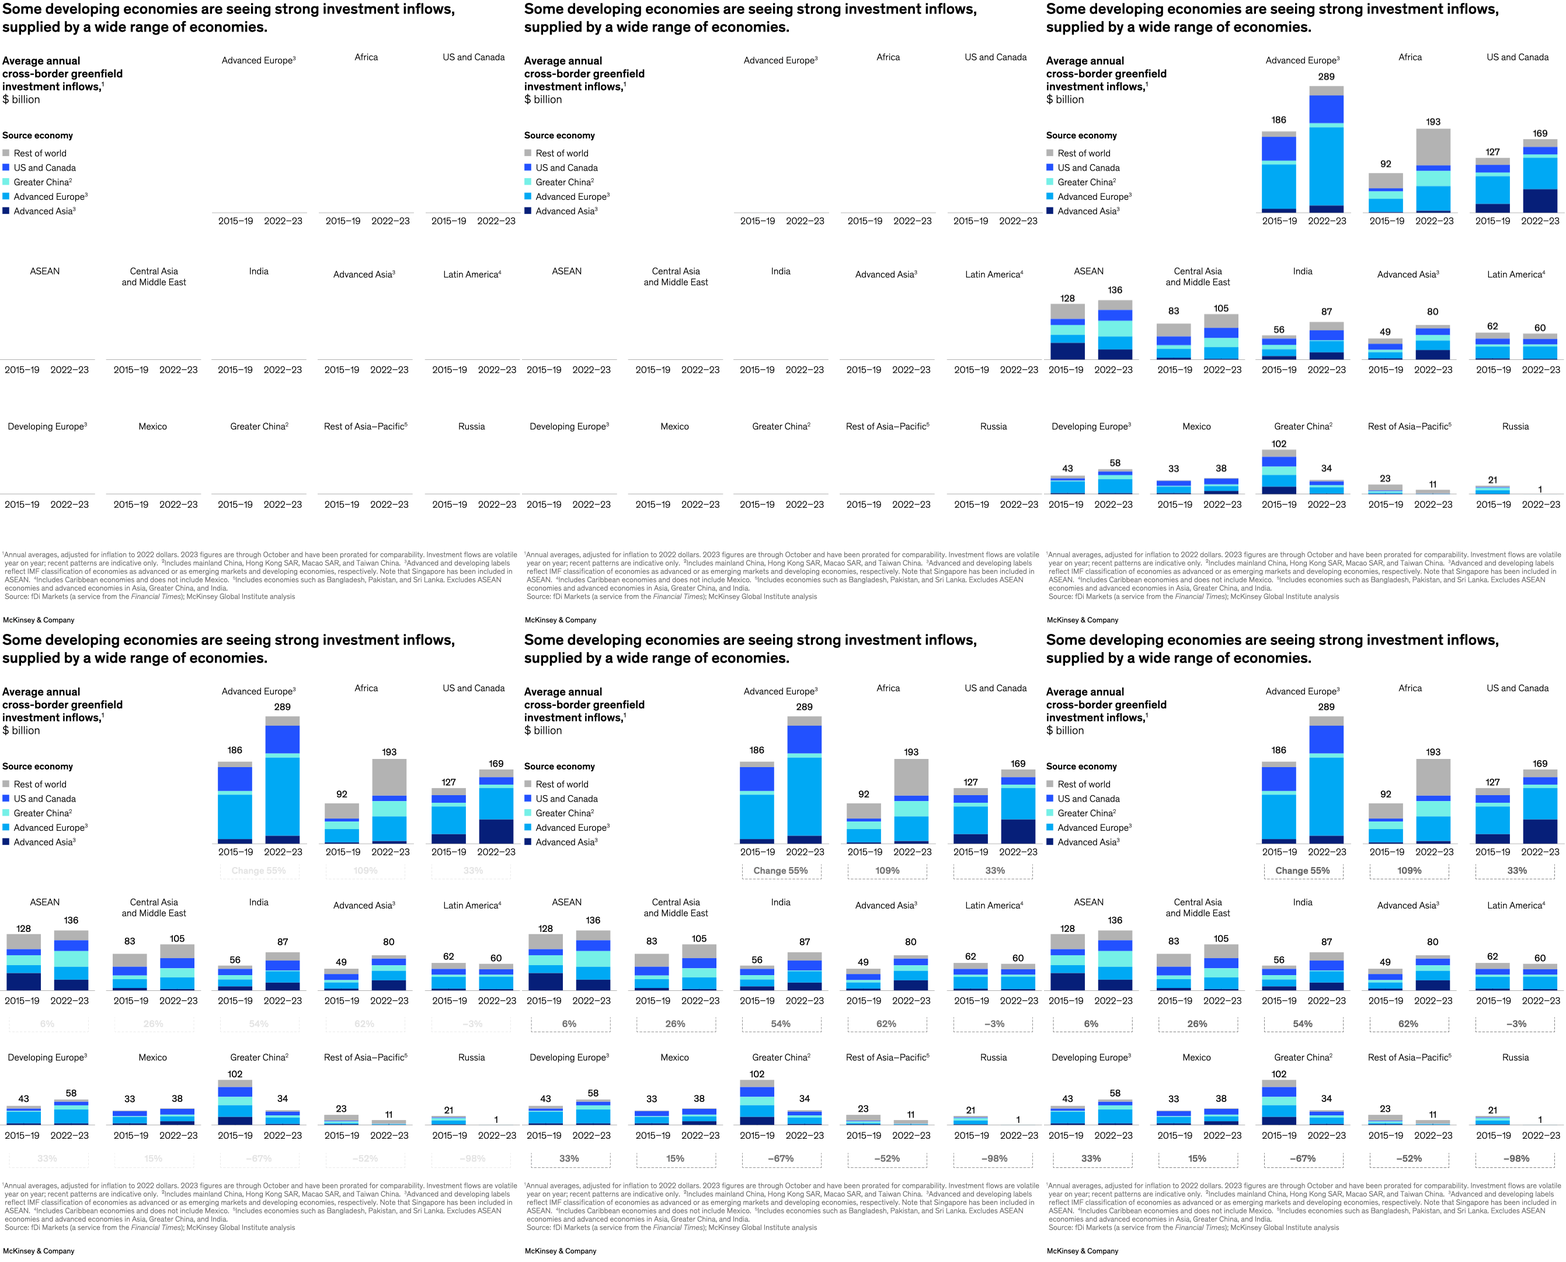
March 4, 2024 – As global trade patterns evolve, taking stock of cross-border greenfield investments could provide a clue about what trade flows might look like going forward. For example, announced investment in Africa and India has risen significantly relative to prepandemic averages—109 percent and 54 percent, respectively, according to Olivia White, a senior partner and a director of McKinsey Global Institute, and coauthors. Announced investment in China and Russia has declined substantially—by 67 percent for Greater China and 98 percent for Russia.
To read the report, see “Geopolitics and the geometry of global trade,” January 17, 2024.
customizer here
Visual form
Grid of stacked-bar small multiples.
Layout / body structure
The page lays out many regional mini-charts in a matrix, each with two bars for 2015 to 2019 and 2022 to 2023, so the reader scans panel by panel across regions and economies.
What is being compared
It compares average annual cross-border greenfield investment inflows across regions and economies while also splitting each bar by the source economy contributing the inflows.
Measurement system
The bars are measured in billions of dollars, the legend identifies source-economy groups, and each panel includes a percentage-change label beneath the pair of bars.
Visible structure inside the graphic
Every panel contains two stacked columns, color bands for Rest of world, US and Canada, Greater China, Advanced Europe, and Advanced Asia, and a boxed change figure under the bars.
Main takeaway from the visual
The chart shows a redistribution of inflows rather than one uniform trend, with India, Africa, Advanced Europe, and the US and Canada rising strongly while Greater China, the rest of Asia-Pacific, and Russia pull back.
Key standout values or extremes
Advanced Europe rises from 186 to 289 billion, Africa from 92 to 193 billion, the US and Canada from 127 to 169 billion, and India from 56 to 87 billion, while Greater China falls from 102 to 34 billion and Russia from 21 to 1 billion.
Controls / sequence, when applicable
This is a static chart image with no in-chart controls to operate.
Companion media, when applicable
There is no separate companion audio or video; the chart image is the full visual on this page.