Source page: McKinsey & Company
Commentary
Germany's natural gas shift
Global Trade | Oil & Gas
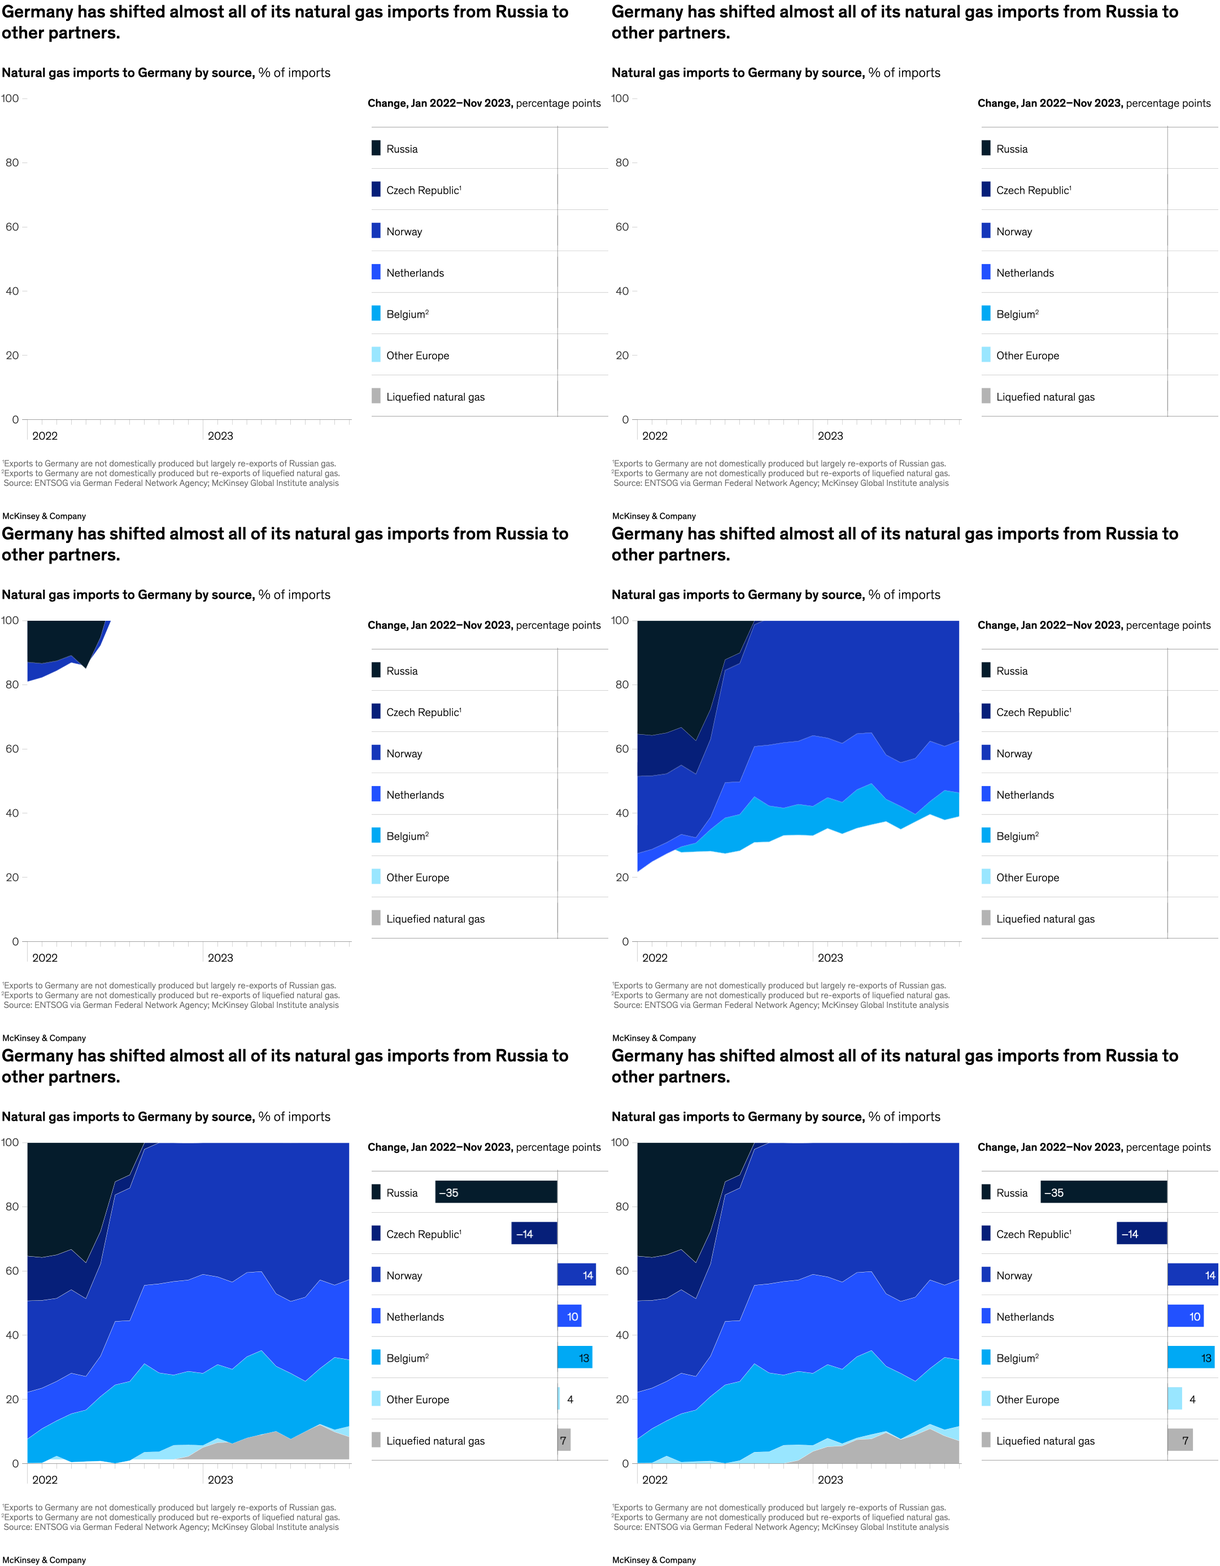
February 26, 2024 – Trade relations have been changing around the world in recent years, in part due to geopolitical upheaval. One example of this reconfiguration, note McKinsey Global Institute director and senior partner Olivia White and colleagues, is the shift in Russia’s share of natural gas exports to Germany following Russia’s invasion of Ukraine. It fell from around 35 percent in January 2022 to less than 1 percent in 2023. However, Germany rapidly tapped alternative sources for its energy, in particular imports of natural gas from Norway, supplemented by liquefied natural gas from the United States.
To read the report, see “Geopolitics and the geometry of global trade,” January 17, 2024.
customizer here
Visual form
Stacked area chart paired with a percentage-point change table.
Layout / body structure
The left side shows the time series of Germany’s gas-import mix across 2022 and 2023, and the right side lists the change by source from January 2022 to November 2023.
What is being compared
It compares the share of Germany’s natural gas imports by source, showing how Russia, Norway, the Netherlands, Belgium, the Czech Republic, other Europe, and liquefied natural gas changed in the mix.
Measurement system
The area chart uses percent of imports on a zero-to-100 scale, and the right-hand comparison uses percentage-point change.
Visible structure inside the graphic
The left plot stacks colored source bands over time, while the right panel uses horizontal bars with signed numbers to show which suppliers lost share and which gained it.
Main takeaway from the visual
Russia’s share collapses out of the mix and the lost volume is absorbed by a spread of other suppliers rather than one single replacement source.
Key standout values or extremes
Russia drops 35 percentage points, the Czech Republic falls 14, while Norway gains 14, Belgium 13, the Netherlands 10, liquefied natural gas 7, and other Europe 4.
Controls / sequence, when applicable
This is a static chart image with no in-chart controls to operate.
Companion media, when applicable
There is no separate companion audio or video; the chart image is the full visual on this page.