Source page: McKinsey & Company
Commentary
Power-full planning
Public Sector | Electric power and natural gas | Renewable energy
February 22, 2024 – US state-level leaders have an opportunity to play a key role in accelerating the transition to clean energy. Planning for power demand under various scenarios is one way leaders can potentially stay a step ahead, according to senior partner Adi Kumar and coauthors. Understanding different projections for future energy demand could help leaders anticipate how resources and planned activities might evolve—while ensuring the grid is still reliable.
To read the article, see “How US states can advance a successful clean-energy transition,” January 29, 2024.
customizer here
Visual form
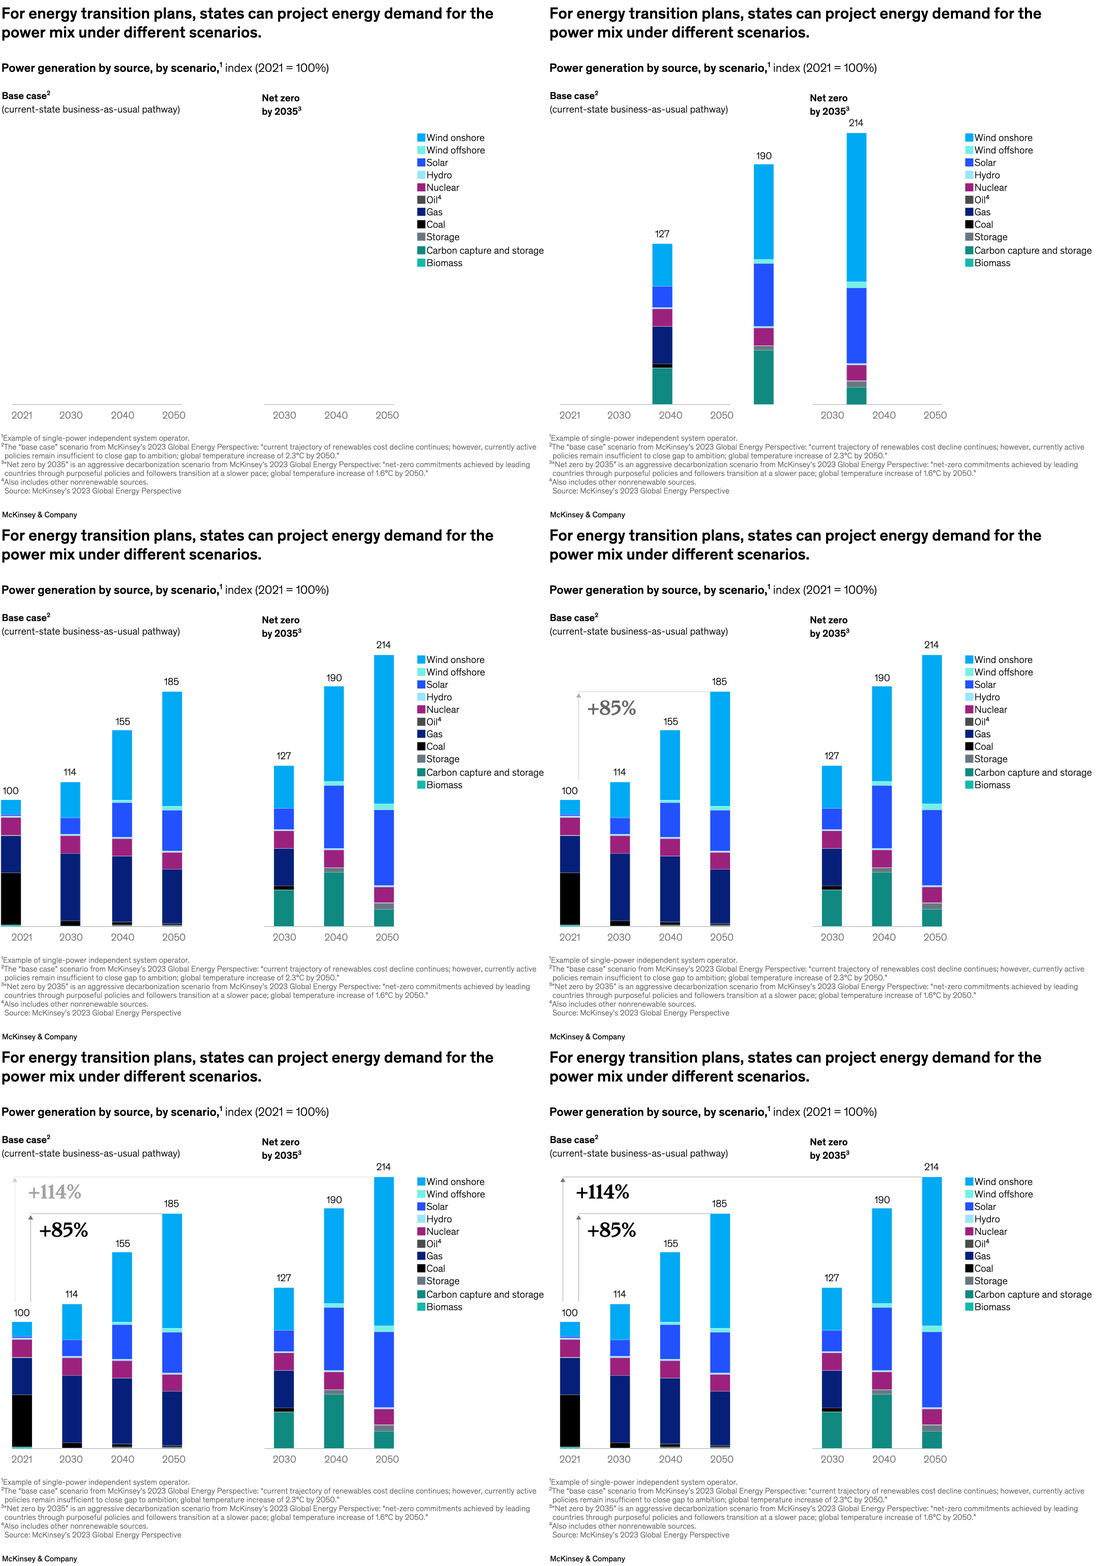
Scenario-based stacked bar chart.
Layout / body structure
The chart is split into a left base-case pathway and a right net-zero-by-2035 pathway, with annual stacked columns inside each scenario block.
What is being compared
It compares the power-generation mix by source under different scenarios and across future years, showing how wind, solar, hydro, nuclear, fossil fuels, storage, carbon capture and storage, and biomass contribute to total generation.
Measurement system
The bars use an index where 2021 equals 100, and callouts summarize roughly +85 percent growth in the base case and +114 percent growth in the net-zero pathway by 2050.
Visible structure inside the graphic
Each column is a multi-color stack, totals are printed above the bars, and the legend on the right maps each color to a generation source.
Main takeaway from the visual
Generation grows in both scenarios, but the cleaner net-zero pathway pushes the total higher and shifts more of the visible stack toward renewables and newer flexibility resources.
Key standout values or extremes
The base-case index rises from 100 in 2021 to 114 in 2030, 155 in 2040, and 185 in 2050, while the net-zero pathway reaches 127 in 2030, 190 in 2040, and 214 in 2050.
Controls / sequence, when applicable
This is a static chart image with no in-chart controls to operate.
Companion media, when applicable
There is no separate companion audio or video; the chart image is the full visual on this page.