Source page: McKinsey & Company
Commentary
High cost of health disparities
Inequality | Women's health
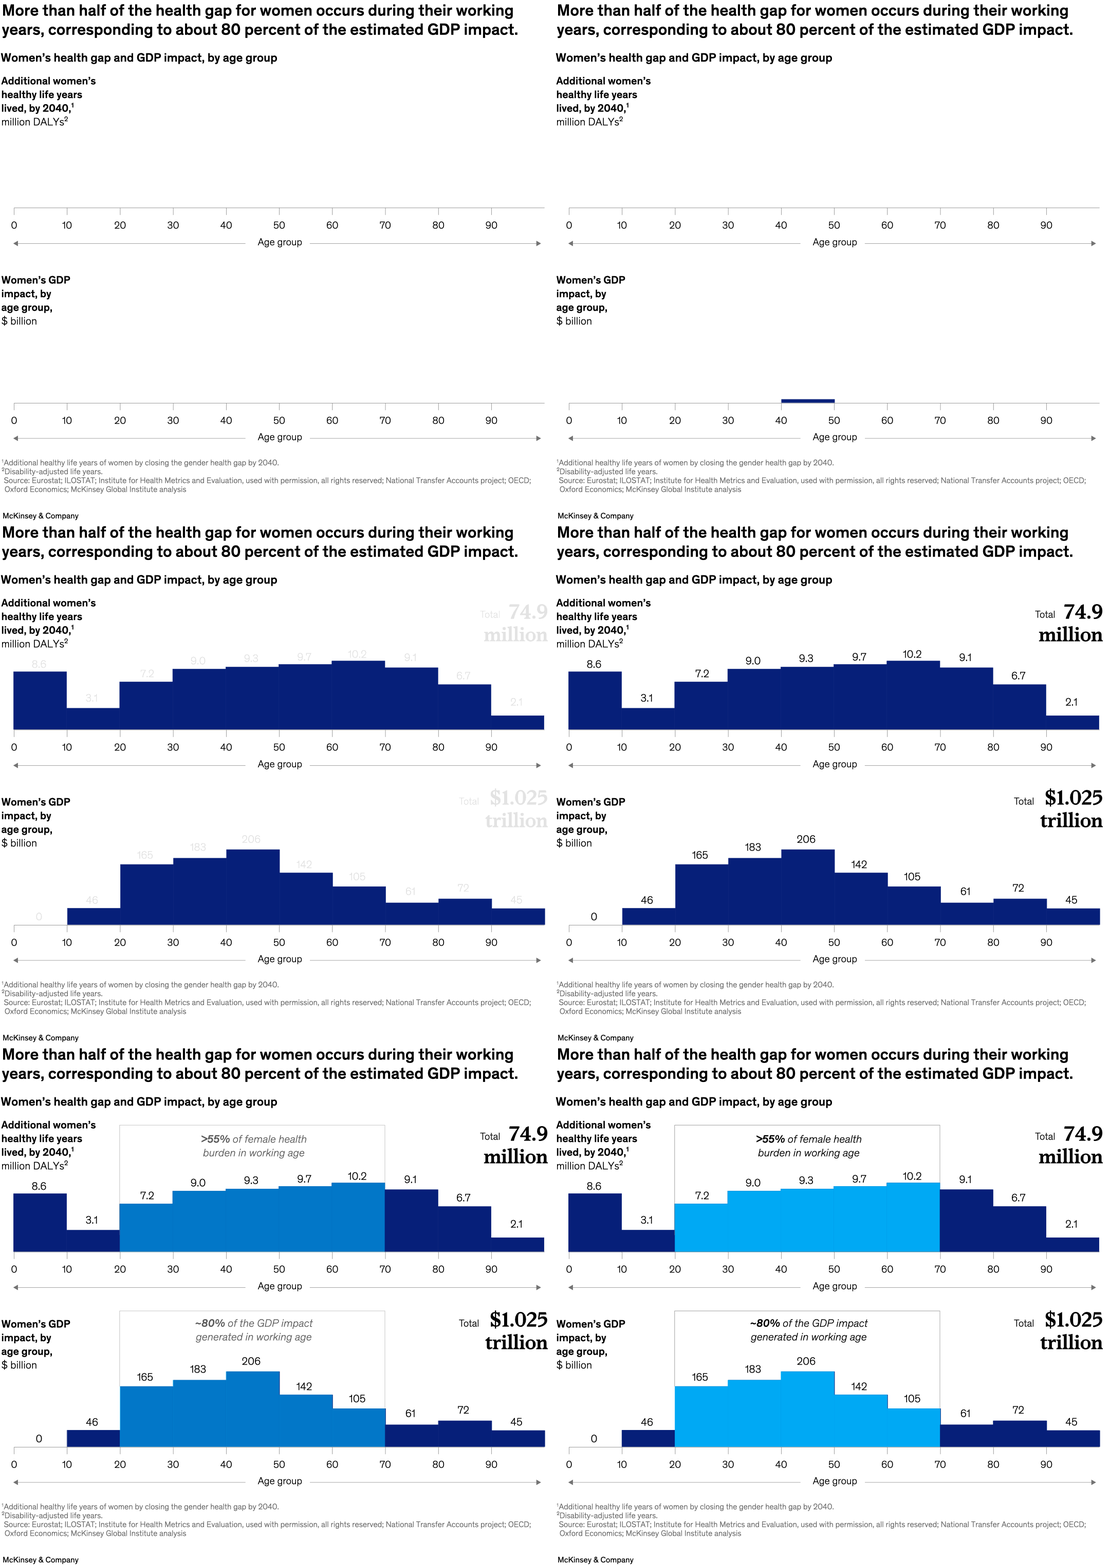
February 16, 2024 – Women spend about 25 percent more time than men in poor health, a gap that, if eliminated, could improve lives and boost global GDP by $1 trillion each year by 2040. More than half of this gap occurs during women’s working years, from 20 to 70, according to senior partners Kweilin Ellingrud and Lucy Pérez and colleagues. Achieving health equity may require addressing data gaps and disparities in healthcare delivery, among other factors.
To read the report, see “Closing the women’s health gap: A $1 trillion opportunity to improve lives and economies,” January 17, 2024.
customizer here
Visual form
Paired age-band bar charts.
Layout / body structure
The top panel shows additional healthy life years by age group and the bottom panel shows GDP impact by age group, with the same age scale running across both panels.
What is being compared
It compares the women’s health gap and the economic value of closing that gap across age groups, with special emphasis on working-age years.
Measurement system
The top chart is measured in million DALYs and the bottom chart in billions of dollars, and both panels include total figures at the far right.
Visible structure inside the graphic
Each panel is built from age-band blocks laid out across the life course, with the working-age span highlighted in bright blue and the nonworking ages shown in darker blue, plus boxed callouts over the working-age segment.
Main takeaway from the visual
The bulk of both the health burden and the GDP opportunity sits in women’s working years, which is why the chart concentrates its emphasis on the 20-to-70 span.
Key standout values or extremes
The top panel totals 74.9 million additional healthy life years and highlights that more than 55 percent of the health burden falls in working age, while the bottom panel totals $1.025 trillion and states that about 80 percent of the GDP impact is generated in working age; the largest single GDP block is 206 in the midlife working-age range.
Controls / sequence, when applicable
This is a static chart image with no in-chart controls to operate.
Companion media, when applicable
There is no separate companion audio or video; the chart image is the full visual on this page.