Source page: McKinsey & Company
Commentary
Transitioning to clean hydrogen
Climate change | Decarbonization | Renewable energy
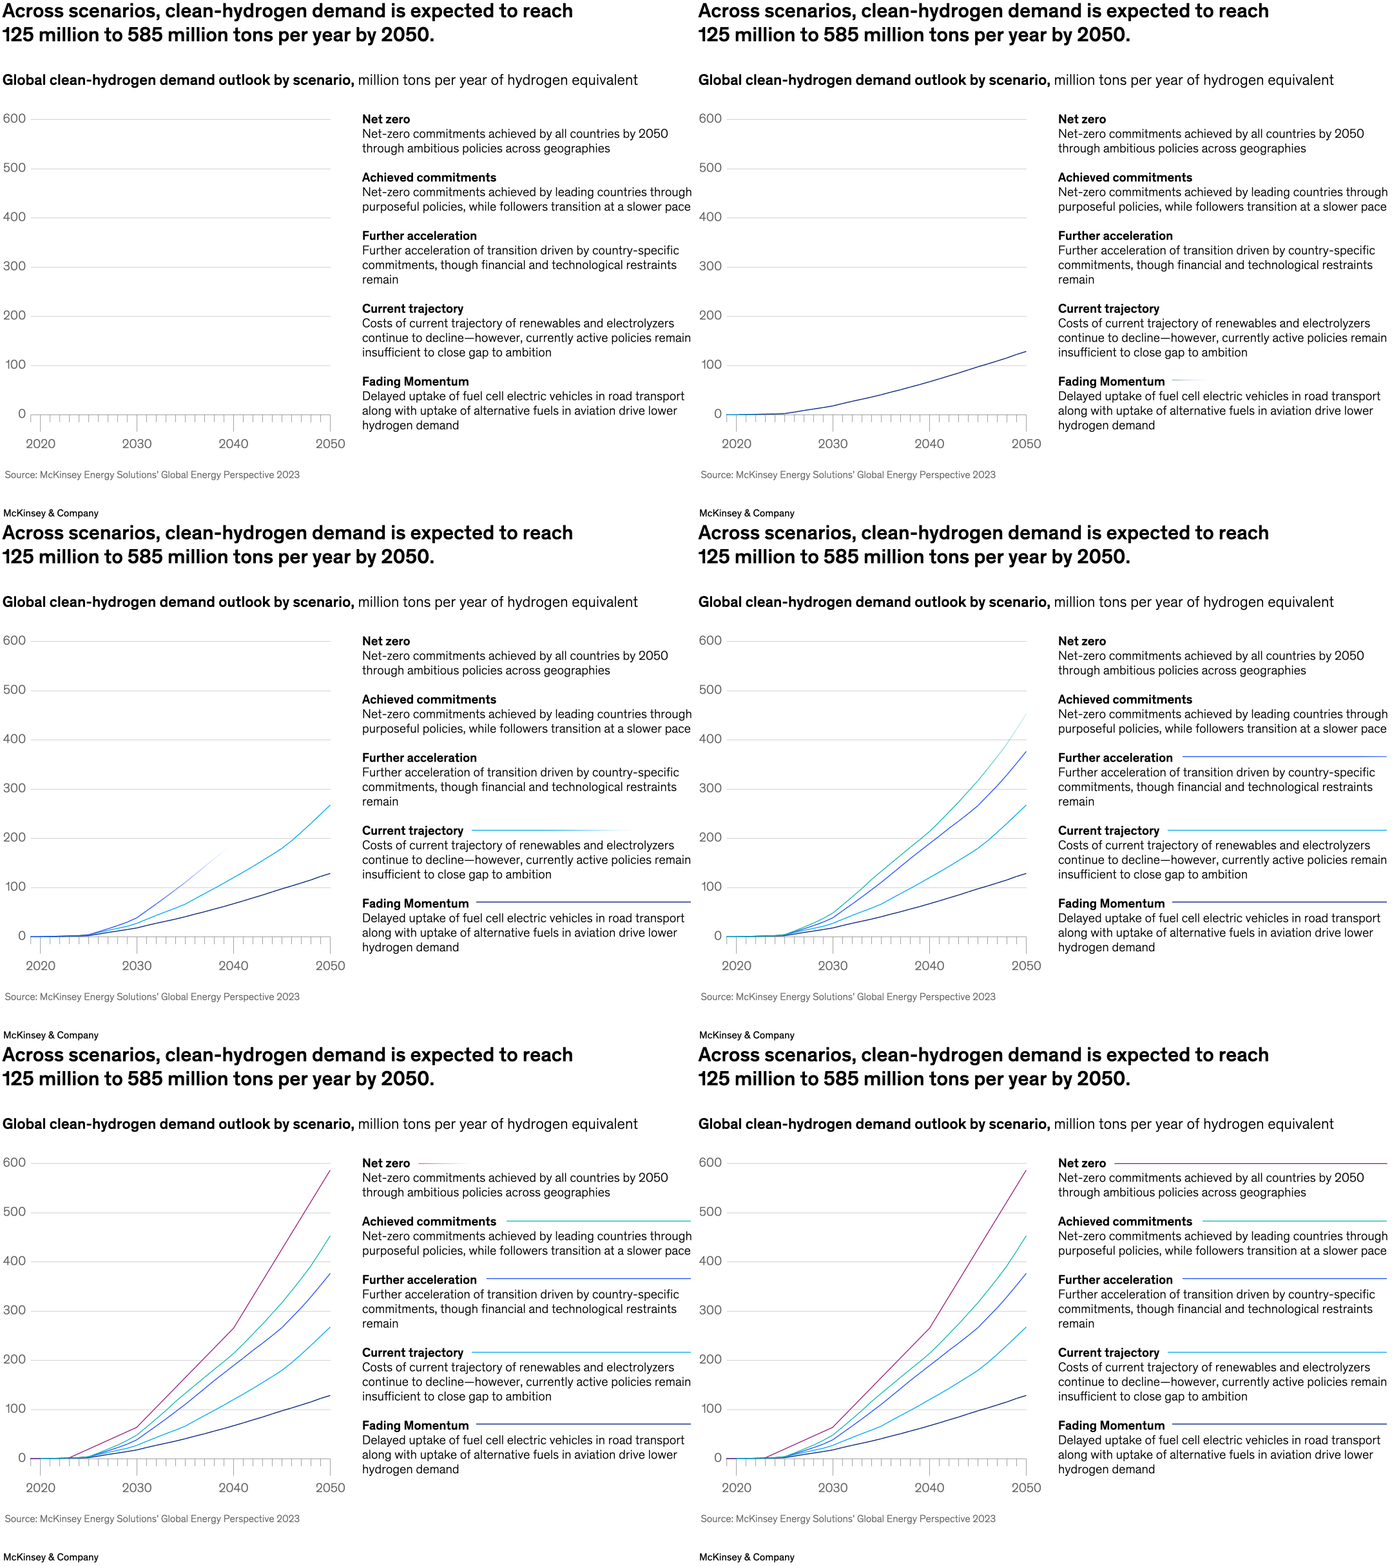
February 12, 2024 – Hydrogen could contribute to decarbonizing the energy system, with emerging applications in steel and heavy road transport, for example. But scaling clean hydrogen, which can be produced with renewable energy, will be key. Senior partner Bernd Heid and colleagues note that clean hydrogen could account for 73 to 100 percent of total demand by 2050. The demand increases could vary greatly, however, depending on how far along countries are in the transition to net zero.
To read the article see “Global Energy Perspective 2023: Hydrogen outlook,” January 10, 2024.
customizer here
Visual form
Multi-line scenario chart.
Layout / body structure
A single line chart occupies the left side of the chart and a labeled scenario key sits on the right, so the reader tracks the lines first and then ties each path to its scenario description.
What is being compared
It compares projected clean-hydrogen demand across multiple transition scenarios through 2050.
Measurement system
The vertical scale is million tons per year of hydrogen equivalent and the horizontal axis runs from 2020 to 2050.
Visible structure inside the graphic
Five scenario lines start close together and then fan out sharply after 2030, while the right-hand text block names the net-zero, achieved-commitments, further-acceleration, current-trajectory, and fading-momentum pathways.
Main takeaway from the visual
The chart makes the range of possible demand outcomes the story, because the distance between scenarios widens dramatically as the transition pace changes.
Key standout values or extremes
By 2050 the demand range spans roughly 125 million to 585 million tons per year, with the net-zero path highest and the fading-momentum path lowest.
Controls / sequence, when applicable
This is a static chart image with no in-chart controls to operate.
Companion media, when applicable
There is no separate companion audio or video; the chart image is the full visual on this page.