Source page: McKinsey & Company
Commentary
Boosting economic empowerment
Economic Development | Growth | Diversity & Inclusion
January 19, 2024 – Davos—the World Economic Forum’s annual meeting—is in full swing through January 19. All this week, our daily charts will focus on some of the key themes of the event, including resilience, sustainability, reimagining globalization, generative AI, and inclusive, equitable growth. For more, see “McKinsey and the World Economic Forum 2024.”
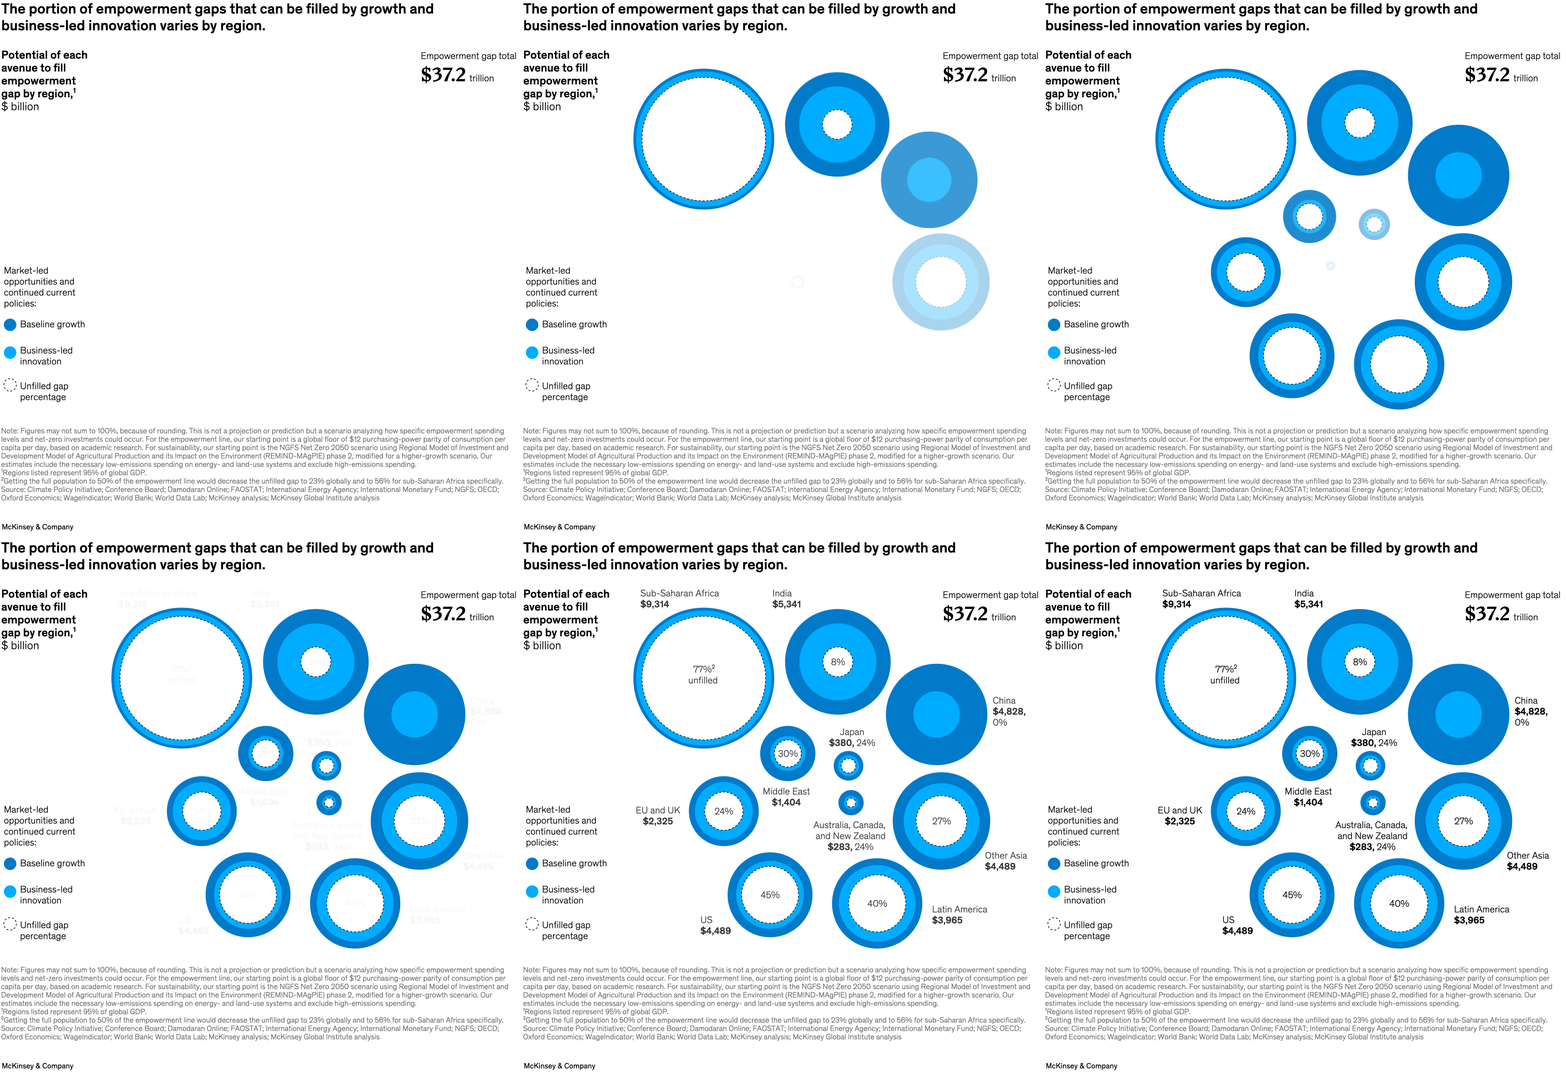
About 4.7 billion people (61 percent of the world’s population) live below the empowerment line—the level at which people can afford to meet essential needs such as nutrition, housing, healthcare, and education. McKinsey Global Institute chair and senior partner Sven Smit and colleagues estimate that closing the empowerment gap would require boosting the spending power of those below the line by $37 trillion over the coming decade. Accelerated growth and business-led innovation could achieve some of those gains, though the impact would vary from region to region. China and India, for example, could erase more than 90 percent of the empowerment gaps, lifting about 700 million people in India and over 730 million in China above the threshold by 2030. The impact would likely be significantly less in regions such as sub-Saharan Africa.
To read the report, see “From poverty to empowerment: Raising the bar for sustainable and inclusive growth,” September 18, 2023.
customizer here
Visual form
Regional ring-map of empowerment gaps.
Layout / body structure
The visual spreads regional circular diagrams across the page, with each circle summarizing how much of the empowerment gap is filled by baseline growth, business-led innovation, and what remains unfilled.
What is being compared
It compares regional empowerment gaps and the share of those gaps that could be closed through growth and business-led innovation across major world regions.
Measurement system
The chart uses billions or trillions of dollars of annual revenue needed to fill the empowerment gap and percentage shares for the filled versus unfilled portions.
Visible structure inside the graphic
Each region is represented by a ring with colored slices for baseline growth and business-led innovation and a white center or inner label indicating the remaining unfilled gap.
Main takeaway from the visual
The share of the gap left unfilled varies sharply by region, with some regions showing only a small sliver of business-led closure and others showing much larger portions already addressed.
Key standout values or extremes
Sub-Saharan Africa is labeled at 9,314 with 77 percent unfilled, India 5,341 with 8 percent unfilled, China 4,828 with 0 percent unfilled, the United States 4,489 with 45 percent unfilled, Latin America 3,965 with 40 percent unfilled, and the empowerment-gap total is shown at 37.2 trillion.
Controls / sequence, when applicable
This is a static chart image with no in-chart controls to operate.
Companion media, when applicable
There is no separate companion audio or video; the chart image is the full visual on this page.