Source page: McKinsey & Company
Commentary
All in the family business
Financial services | Private equity
January 9, 2024 – Family-owned businesses have long played an outsize role in the global economy. Analysis by senior partner Acha Leke and coauthors finds that family-owned businesses account for more than 70 percent of global GDP and about 60 percent of global employment. The structures and practices used by these businesses, such as focusing on purpose beyond profits, may help them to exhibit stronger performance during downturns than some of their nonfamily-owned peers.
To read the report, see “The secrets of outperforming family-owned businesses: How they create value—and how you can become one,” November 28, 2023.
customizer here
Visual form
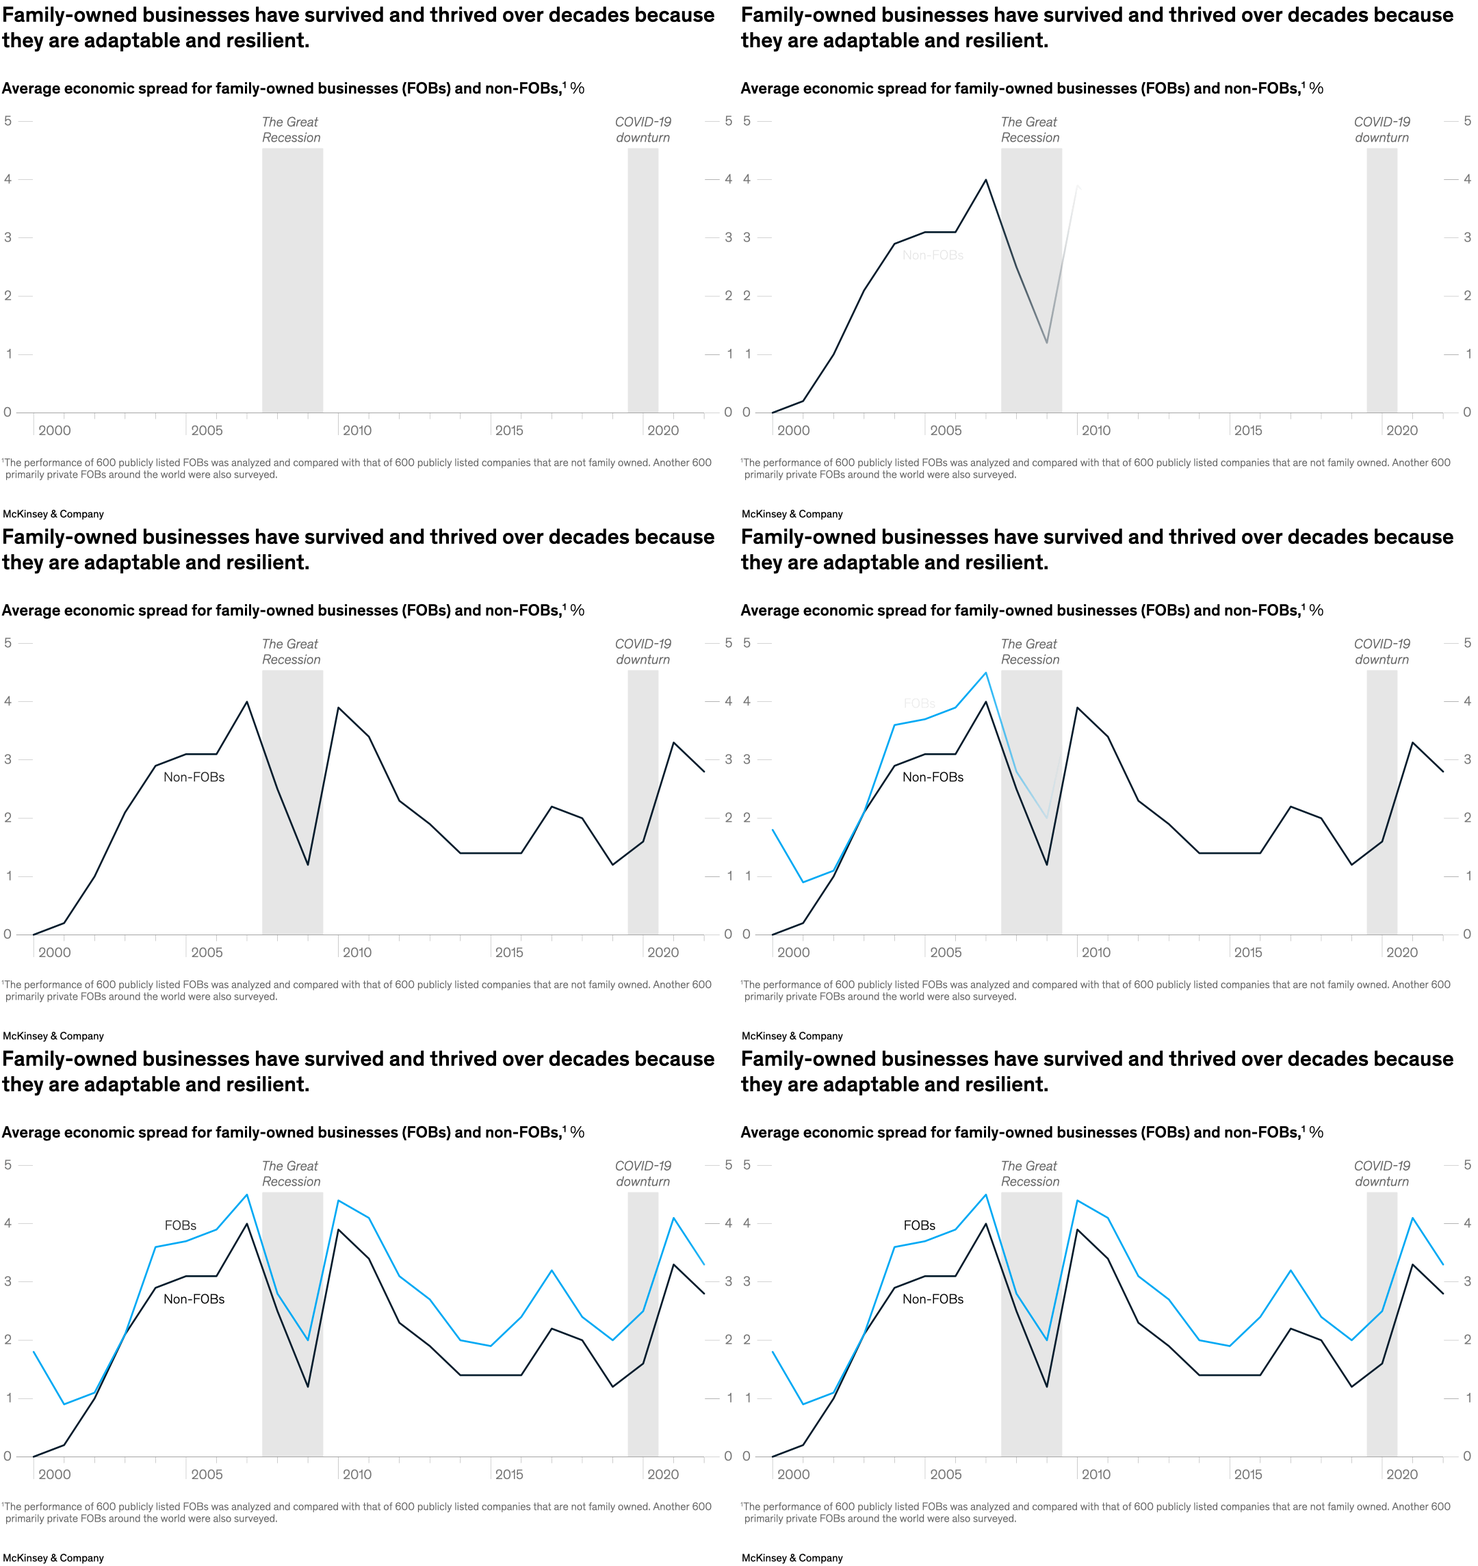
Dual-line time-series chart. The chart uses two long-run lines to compare family-owned businesses with non-family-owned businesses across business cycles.
Layout / body structure
Layout / body structure: the page centers a single chart with the two lines running across the full horizontal time axis and shaded recession bands sitting behind them. The eye reads left to right through the historical series, with downturn markers used as visual checkpoints.
What is being compared
What is being compared: the chart compares average economic spread for family-owned businesses and non-family-owned businesses over time. The comparison is not across sectors or regions but across ownership models and across changing macro periods, including recessionary episodes.
Measurement system
Measurement system: the vertical measure is economic spread expressed as a percentage, and the horizontal measure is time. The two line colors distinguish the ownership groups, while the shaded bands mark major downturn periods such as the Great Recession and the COVID-19 downturn.
Visible structure inside the graphic
Visible structure inside the graphic: the chart is built from two continuous lines, a shared vertical scale, and background shading that slices the series into expansion and downturn intervals. The recession bands are structural anchors because they show how the distance between the two lines behaves when conditions deteriorate.
Main takeaway from the visual
Main takeaway from the visual: the family-owned-business line stays above the non-family-owned-business line for most of the series and remains more resilient during the downturn bands. The graphic makes adaptability and resilience visible as a persistent spread advantage rather than as a one-period result.
Key standout values or extremes
Key standout values or extremes: the strongest visual signal is the sustained separation between the two lines through the two shaded downturn periods. Instead of one oversized endpoint label, the chart emphasizes that the family-owned-business series holds the higher position across multiple phases of the cycle.
Controls / sequence, when applicable
This is a static chart image with no in-chart controls to operate.
Companion media, when applicable
There is no separate companion audio or video; the chart image is the full visual on this page.