Source page: McKinsey & Company
Commentary
Broader travel horizons
India | Travel
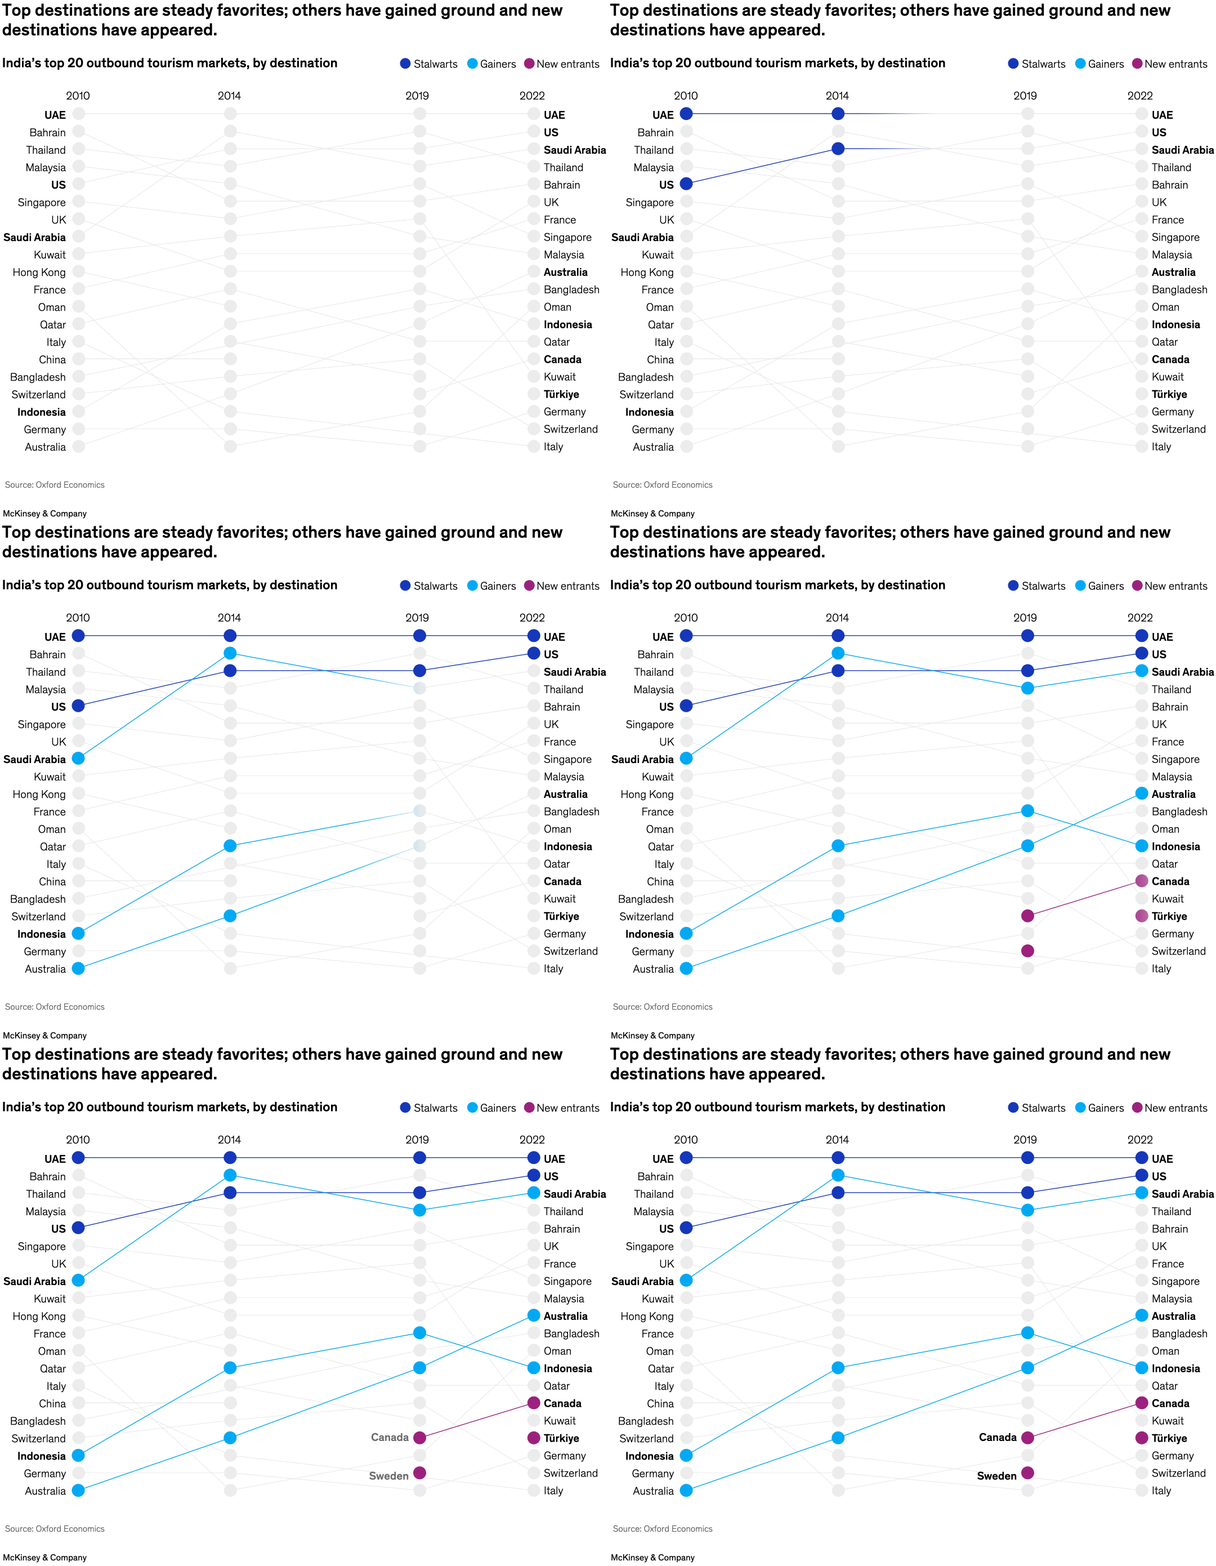
December 19, 2023 – Fueled by a booming economy and the world’s largest population, more Indian tourists are expected to set out for international destinations in coming years, with the number of trips increasing from 13 million in 2022 to potentially more than 80 million in 2040. Senior partner Neelesh Mundra and colleagues find that 70 percent of Indian travelers chose nearby destinations for the past decade, particularly in the Middle East and South Asia. The United Arab Emirates was the most visited by Indian leisure travelers, followed by the United States and Saudi Arabia.
To read the article, see “From India to the world: Unleashing the potential of India’s tourists,” November 1, 2023.
customizer here
Visual form
Rank-flow bump chart. The chart uses connected destination labels across multiple year columns to show which outbound travel destinations remain dominant, which rise, and which newly enter the ranking set.
Layout / body structure
Layout / body structure: the chart is laid out in vertical year columns for 2010, 2014, 2019, and 2022, with colored lines linking destinations from one column to the next. Reader follows the flows left to right and uses the legend to distinguish stalwarts, gainers, and new entrants.
What is being compared
What is being compared: the visual compares destination rankings for Indian international travel across four time points. It shows both persistence and change by tracking how individual destinations hold their place, climb, or newly appear in the ranked set over time.
Measurement system
Measurement system: the graphic is built on rank position rather than on bar length or explicit volumes. Color serves as the categorical measurement key, identifying whether a destination belongs to the stalwart, gainer, or new-entrant group.
Visible structure inside the graphic
Visible structure inside the graphic: the chart consists of four rank columns, connecting lines, right-edge destination labels, and a legend that groups the line colors into three destination types. The line paths create the structure, letting the reader see continuity, upward movement, and fresh entries without switching chart form.
Main takeaway from the visual
Main takeaway from the visual: the destination set broadens over time, but the top of the ranking still contains durable favorites. The bump-chart layout makes that visible by holding places such as the UAE and the United States near the top while also showing a wider mix of gainers and new entrants by 2022.
Key standout values or extremes
Key standout values or extremes: the chart spans four benchmark years and the source range points to international trips rising from 13 million in 2022 to more than 80 million in 2040. Within the ranking itself, the UAE and the United States remain among the strongest visible stalwarts, while destinations such as Saudi Arabia and Bahrain are part of the later-period expansion story.
Controls / sequence, when applicable
This is a static chart image with no in-chart controls to operate.
Companion media, when applicable
There is no separate companion audio or video; the chart image is the full visual on this page.