Source page: McKinsey & Company
Commentary
A boon for mortgage brokers?
Financial services | Real estate
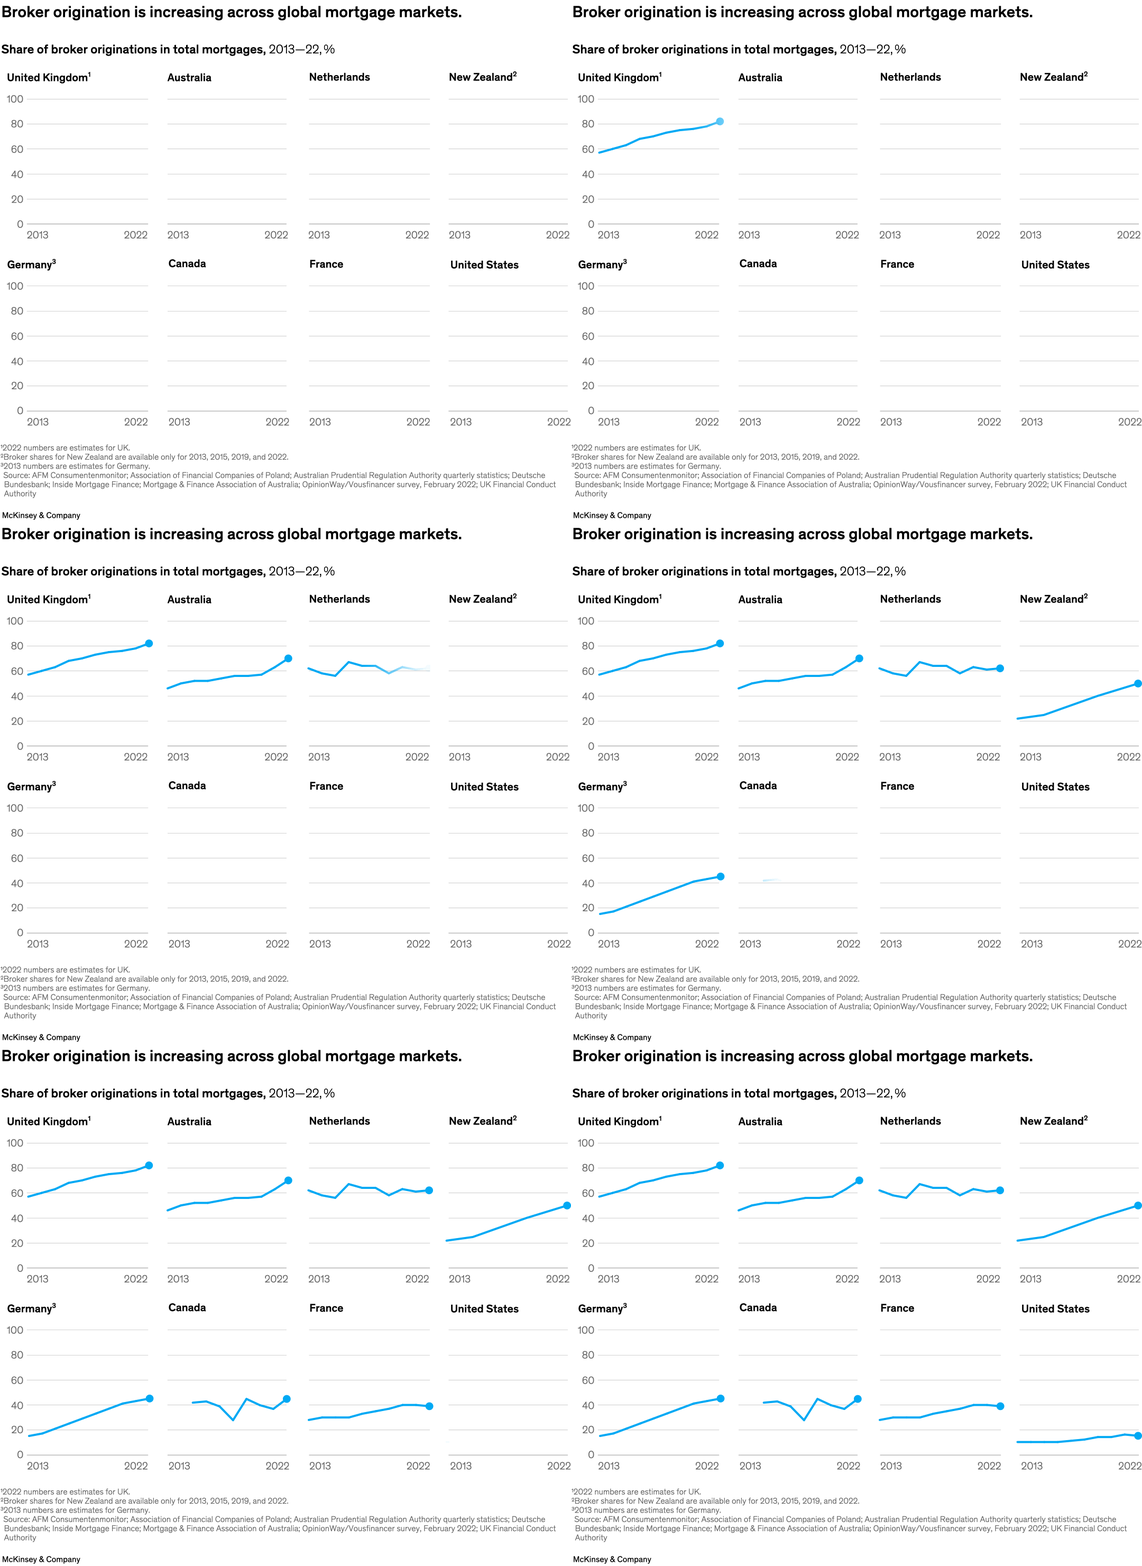
December 12, 2023 – The turbulent global mortgage climate has been challenging for many financial institutions. Mortgage brokers, though, are in a slightly more comfortable position thanks in part to structural changes in mortgage origination in the past decade, such as banking digitization. Those changes allowed new lenders to enter the market through innovative digital platforms, gaining share from larger incumbents, senior partner Joydeep Sengupta and colleagues explain. As a result, there has been an uptick in broker origination in several countries’ mortgage markets. This competitive landscape offers an opportunity for incumbents to collaborate with brokers for mutual benefit.
To read the article, see “Brokering growth in the mortgage market,” November 16, 2023.
customizer here
Visual form
Multi-panel line-chart display. Each panel traces the share of broker originations in total mortgages for a different country over the same time span.
Layout / body structure
The chart is arranged as a grid of country-level small multiples read left to right and then top to bottom. Each panel contains a single blue line, a shared time range from 2013 to 2022, and the same percentage scale so the country trends can be compared directly.
What is being compared
The visual compares broker-origination share across several mortgage markets including the United Kingdom, Australia, the Netherlands, New Zealand, Germany, Canada, France, and the United States. The point is to compare how strongly intermediary-led origination has grown in one country versus another over the same decade.
Measurement system
The unit is percentage share of broker originations in total mortgages, with the vertical axis running up toward 100 and the horizontal axis running from 2013 to 2022. Because every panel uses the same scale, the slopes can be read as comparable changes in share rather than isolated country stories.
Visible structure inside the graphic
The display uses repeated country panels with one line per country and minimal clutter. This small-multiple structure is important because it shows which markets rise smoothly, which fluctuate before climbing, and which start low but still trend upward over time.
Main takeaway from the visual
Broker origination is rising across global mortgage markets, but the shape and maturity of that rise differ by country. The repeated country panels make that visible by showing already-high broker shares climbing further in places such as the United Kingdom and Australia while lower-share markets such as the United States still move upward from a much smaller base.
Key standout values or extremes
The United Kingdom finishes near the 80 percent line, making it one of the highest broker-share markets shown. Australia also climbs into the 70 percent range, New Zealand rises from a much lower starting point to about half the market, and the United States remains comparatively low even as it edges up over the period.
Controls / sequence, when applicable
This is a static chart image with no in-chart controls to operate.
Companion media, when applicable
There is no separate companion audio or video; the chart image is the full visual on this page.