Source page: McKinsey & Company
Commentary
A ways to go to achieve net zero
Climate change | Sustainability
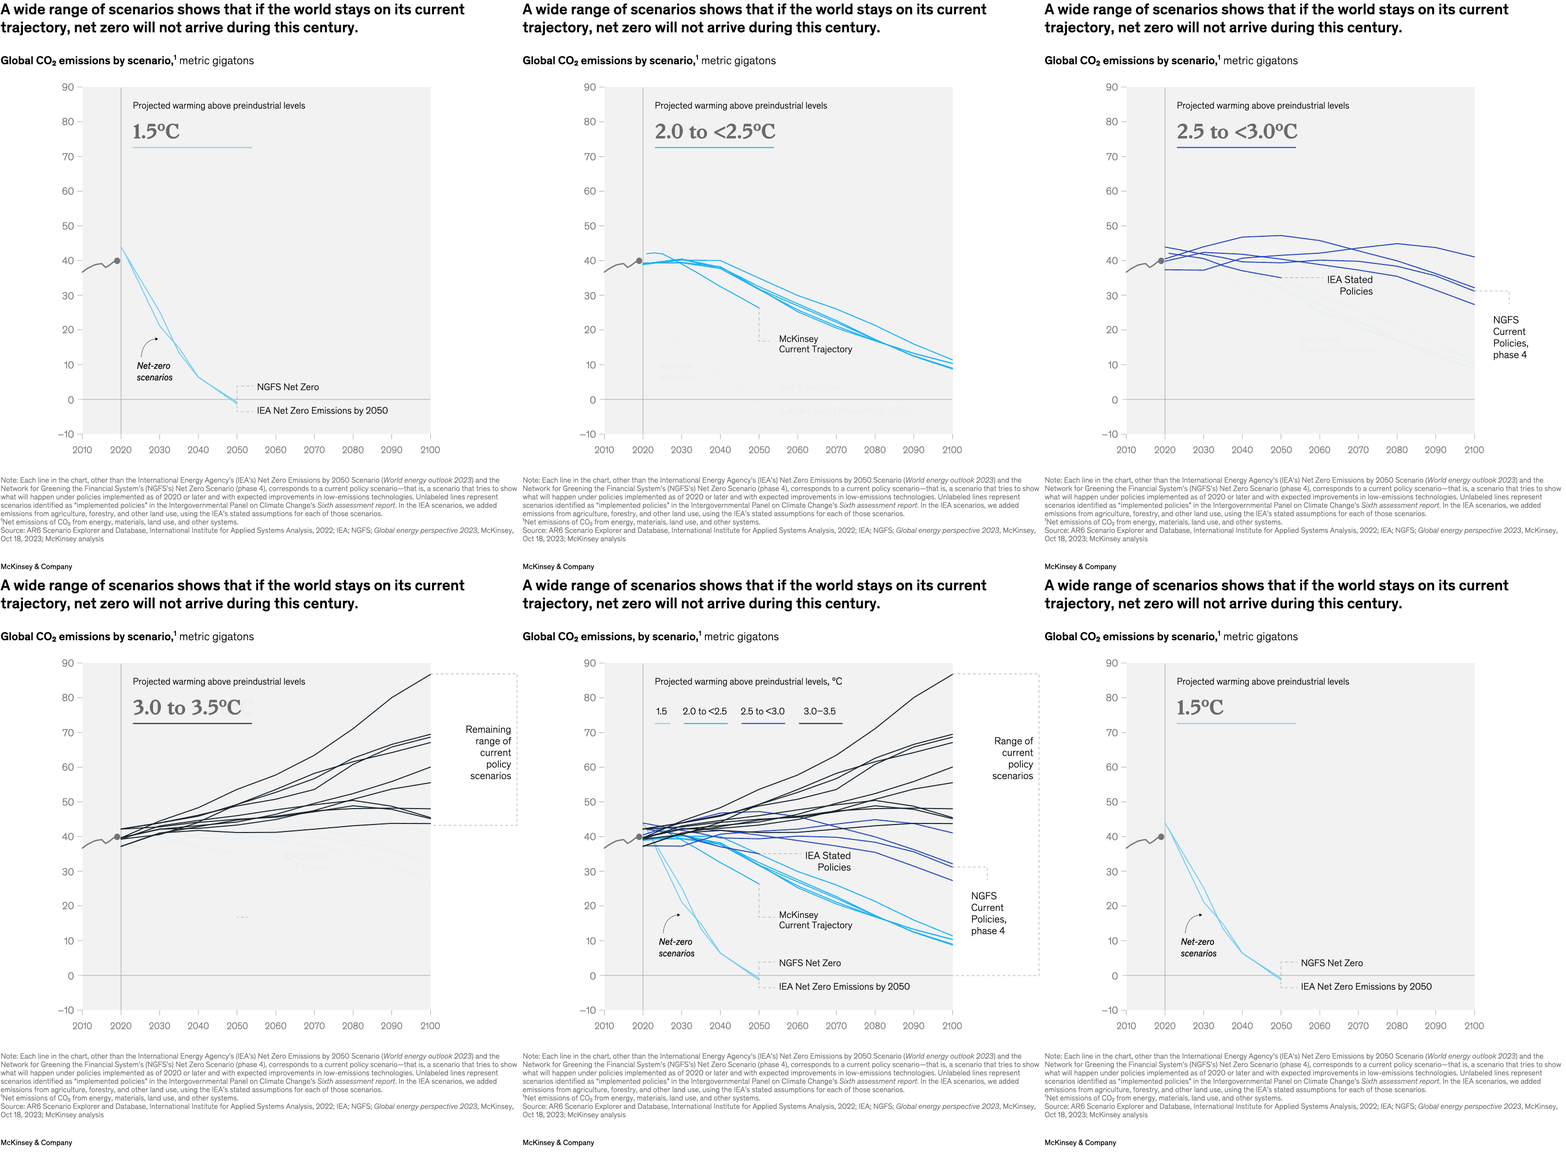
December 8, 2023 – Despite meaningful momentum, the world is not on track to reach the goal of net-zero emissions by 2050. After reviewing 23 current climate policy scenarios, McKinsey Global Institute partner Mekala Krishnan and coauthors found that none would meet net-zero global CO2 emissions by the end of this century. Working toward the 1.5° pathway has been slower than preferred due in part to the complexity of transforming global energy systems, land use, and materials in a coordinated way.
To read the report, see “An affordable, reliable, competitive path to net zero,” November 30, 2023. For more on COP28, the United Nations’ annual climate change conference, head to “McKinsey at COP28.”
customizer here
Visual form
Scenario line chart. It combines a historical emissions path with projected scenario trajectories and a net-zero reference path on one long-run time axis.
Layout / body structure
The visual is built as a single chart read left to right from the historical period into the projected period. Reader first sees emissions history, then the branching scenario lines after the current period, and finally the net-zero reference trajectories extending toward the later decades of the century.
What is being compared
The chart compares global carbon-dioxide emissions across scenario families rather than across countries or sectors. It sets current-policy or current-trajectory scenarios against net-zero reference paths to show how far the world remains from the net-zero objective.
Measurement system
The vertical axis is metric gigatons of global CO2 emissions, and the horizontal axis spans the long run from the early 2000s through the end of the century. The line colors and labels separate after-current-scenarios projections from the steeper net-zero reference pathways.
Visible structure inside the graphic
The chart contains one main historical line, a cluster of projected scenario lines, and labeled reference paths associated with net zero and a 1.5 degree target framing. The structure is intentionally sparse, so the eye focuses on the distance between the emissions trajectories that continue above zero and the ones that descend rapidly toward it.
Main takeaway from the visual
The world is still a long way from a net-zero trajectory. The gap is visible because the current-path scenarios decline too slowly and stay well above zero, while the net-zero reference lines fall much more sharply and hit zero far earlier.
Key standout values or extremes
The chart labels the net-zero reference around 2050, while the source range notes that none of the 23 current policy scenarios reviewed would deliver net-zero global CO2 emissions by the end of this century. That contrast between a zero line near midcentury and much higher scenario levels later in the timeline is the dominant quantitative message.
Controls / sequence, when applicable
This is a static chart image with no in-chart controls to operate.
Companion media, when applicable
There is no separate companion audio or video; the chart image is the full visual on this page.