Source page: McKinsey & Company
Commentary
Nurses’ ongoing burnout
Healthcare | Public Sector
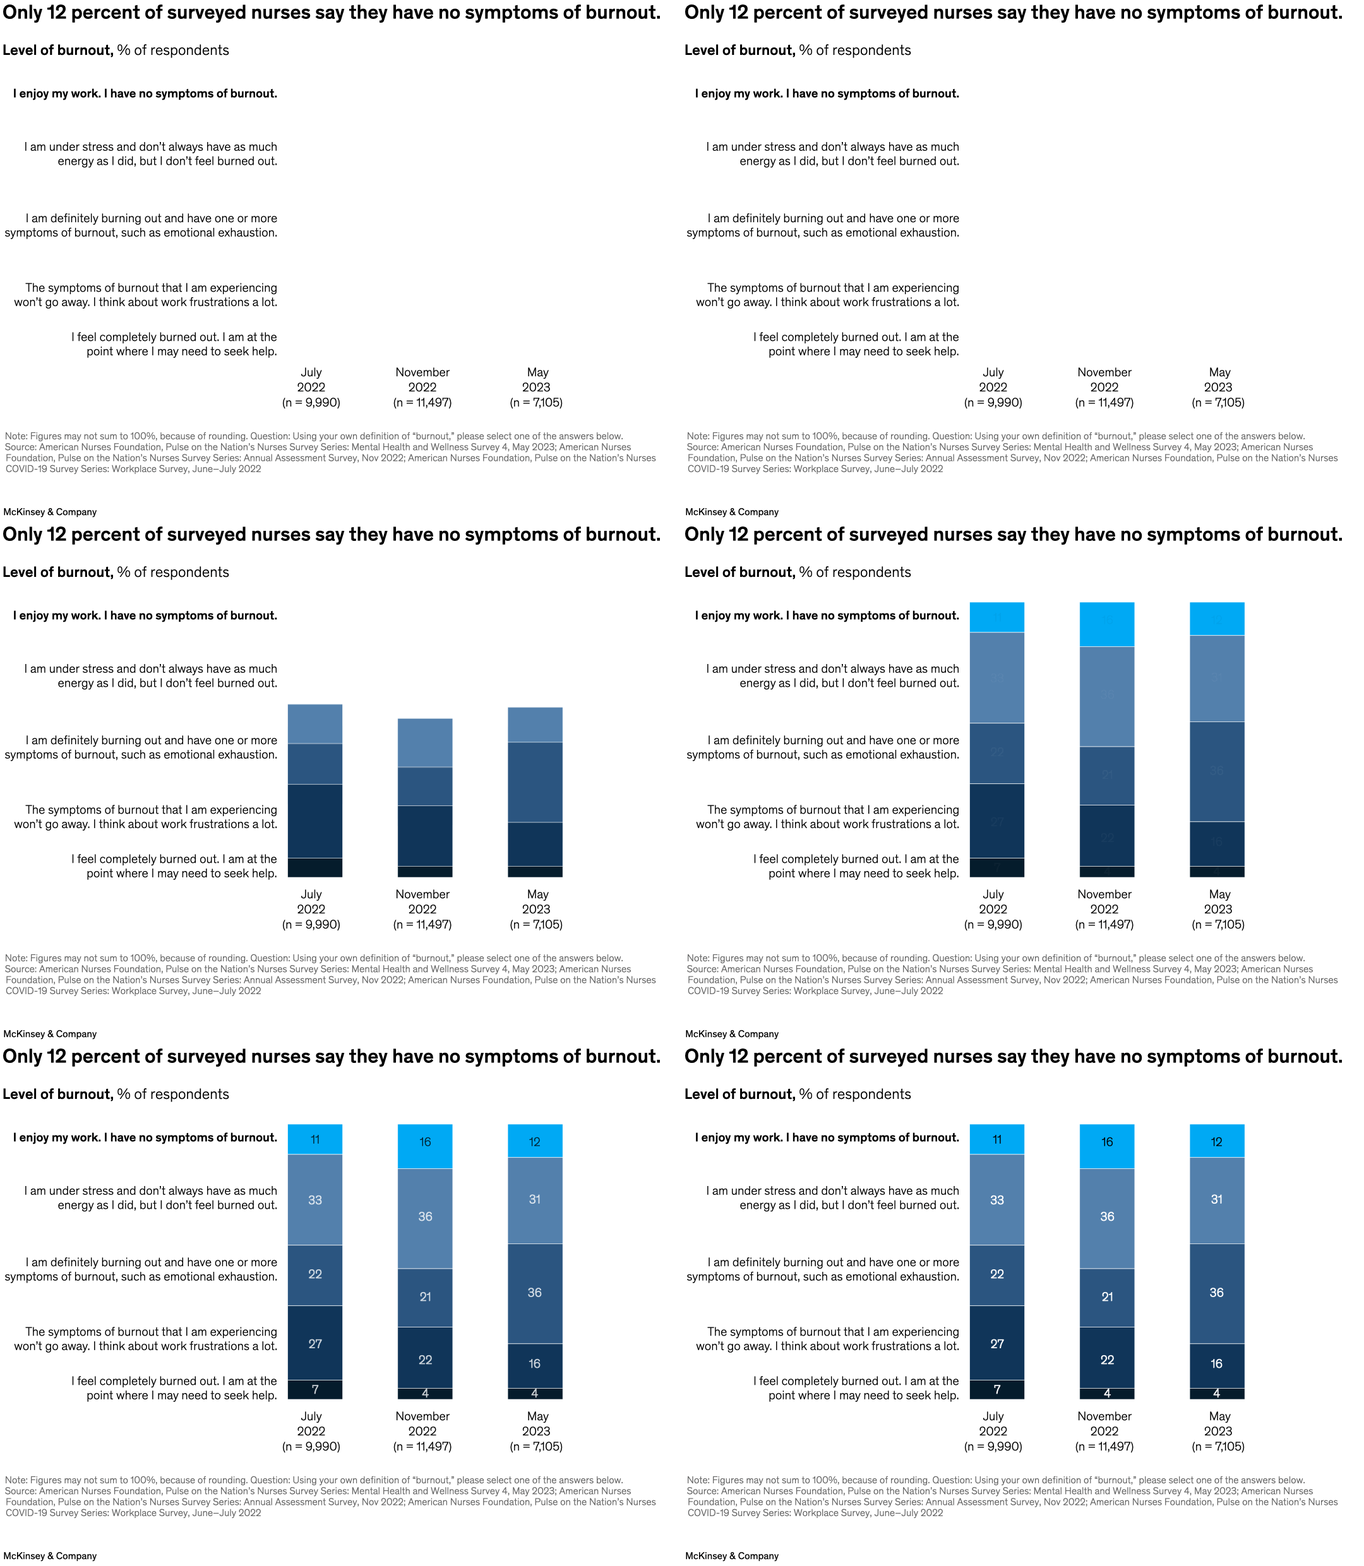
December 7, 2023 – Years after the start of the COVID-19 pandemic, burnout among healthcare workers hasn’t abated. Among more than 7,000 US nurses surveyed earlier this year, only 12 percent indicated they have no symptoms of burnout, down from 16 percent in a November 2022 survey, senior partner Gretchen Berlin and coauthors note. Insufficient staffing, too many administrative tasks, and high patient loads were among the reported contributors to workplace burnout.
To read the article, see “Understanding and prioritizing nurses’ mental health and well-being,” November 6, 2023.
customizer here
Visual form
Stacked bar chart across survey waves. Each bar breaks the nursing population into burnout levels, so the reader can see how the composition changes over time rather than looking at only one headline number.
Layout / body structure
The chart is arranged as three vertical columns for July 2022, November 2022, and May 2023. Each column is stacked from the least severe experience at the top to the most severe at the bottom, and the category descriptions are listed at left so the segments can be read in order.
What is being compared
The visual compares the distribution of burnout intensity among surveyed nurses across three survey dates. It is comparing proportions in several burnout categories, not just the share with burnout versus without burnout.
Measurement system
The unit is percentage of respondents, with each stack summing to 100 percent. The segment labels inside the bars carry the percentages directly, so the reader can compare how each burnout category expands or contracts from one survey wave to the next.
Visible structure inside the graphic
Each bar is split into multiple blue segments corresponding to no symptoms, stress without burnout, one or more symptoms of burnout, frustration, and complete burnout. The repeated stacks show both the stable top segment of nurses with no symptoms and the shifting middle and lower segments where symptom burden is heavier.
Main takeaway from the visual
Burnout remains widespread and the healthier end of the distribution is small. The chart makes that visible by showing a thin top segment for nurses with no symptoms and much larger combined middle and lower segments representing nurses with some degree of burnout or emotional strain.
Key standout values or extremes
Only 12 percent of surveyed nurses in the latest bar say they have no symptoms of burnout, down from 16 percent in November 2022. The segment for nurses reporting one or more symptoms rises to 36 percent in May 2023, making it one of the largest visible portions of the final stack.
Controls / sequence, when applicable
This is a static chart image with no in-chart controls to operate.
Companion media, when applicable
There is no separate companion audio or video; the chart image is the full visual on this page.