Source page: McKinsey & Company
Commentary
Veterans’ untapped earning potential
Jobs | Organization
November 29, 2023 – US military veterans may be missing out on potential earnings after active duty. More than 150,000 service members leave the military each year, but 90,000 of them end up earning less than they did on active duty. Improving the employment outcomes for the latter cohort could amount to collective earnings of almost $15 billion over ten years, senior partner Scott Blackburn and colleagues note in their analysis. This presents an opportunity for organizations seeking workers with ready-made skills.
To read the article, see “From the military to the workforce: How to leverage veterans’ skills,” November 8, 2023.
customizer here
Visual form
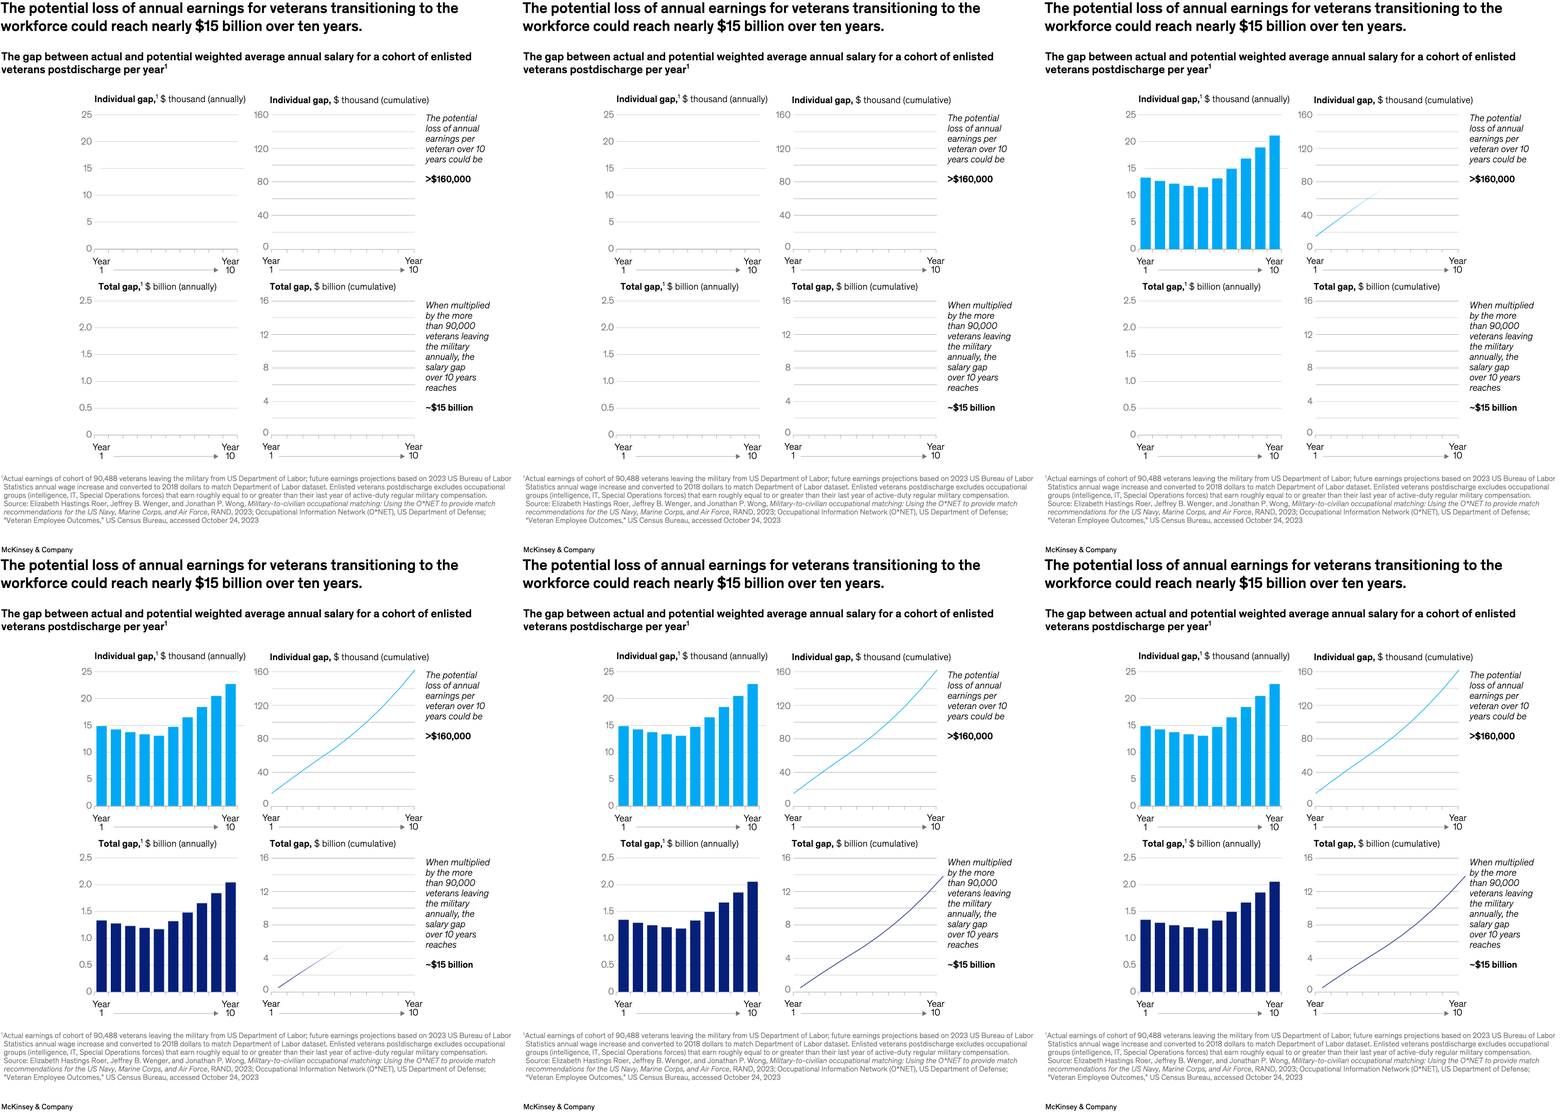
Four-panel bar-and-line dashboard. Two panels focus on the individual veteran earnings gap and two panels scale that gap up to the total annual and cumulative economy-wide loss.
Layout / body structure
The chart is arranged as a two-by-two grid read left to right and then top to bottom. The top row shows the annual individual gap as bars and the cumulative individual gap as a line, while the bottom row mirrors that structure for the total dollar gap across the cohort.
What is being compared
The visual compares actual versus potential postdischarge earnings over the first ten years after military service. It compares annual gaps with cumulative gaps and individual-level losses with the aggregate loss once the analysis is scaled to the broader veteran cohort.
Measurement system
The top row is measured in thousands of dollars, and the bottom row is measured in billions of dollars. The horizontal axis in each panel runs from year 1 to year 10, so the reader can see how the annual shortfall evolves and how the cumulative total accelerates over time.
Visible structure inside the graphic
The left-side panels use vertical bars to show year-by-year gaps, and the right-side panels use rising lines to show cumulative accumulation. The repetition of annual on the left and cumulative on the right makes the dashboard easy to parse as two related comparisons at two different scales.
Main takeaway from the visual
The earnings penalty from a weak veteran-to-civilian job match compounds over time and becomes very large when spread across the full cohort. The dashboard makes that visible by showing annual gaps that rise into later years and cumulative lines that bend steadily upward toward very large ten-year totals.
Key standout values or extremes
At the individual level, the cumulative earnings loss over ten years is labeled at more than 160,000 dollars. At the total level, the chart states that the ten-year cumulative earnings gap reaches about 15 billion dollars, while the final annual total gap rises to just above 2 billion dollars.
Controls / sequence, when applicable
This is a static chart image with no in-chart controls to operate.
Companion media, when applicable
There is no separate companion audio or video; the chart image is the full visual on this page.