Source page: McKinsey & Company
Commentary
Who needs a nap?
Healthcare | Leadership | Workplace
November 17, 2023 – Workers around the globe have something in common: they’re exhausted. In 29 out of 30 countries, more than a third of respondents to a McKinsey Health Institute survey of 30,000 employees reported experiencing fatigue. Senior partner Drew Ungerman and coauthors explain that workplace “enablers” aimed at offsetting job demands, such as career customization and access to health resources, could improve workers’ job satisfaction.
To read the article, see “Reframing employee health: Moving beyond burnout to holistic health,” November 2, 2023.
customizer here
Visual form
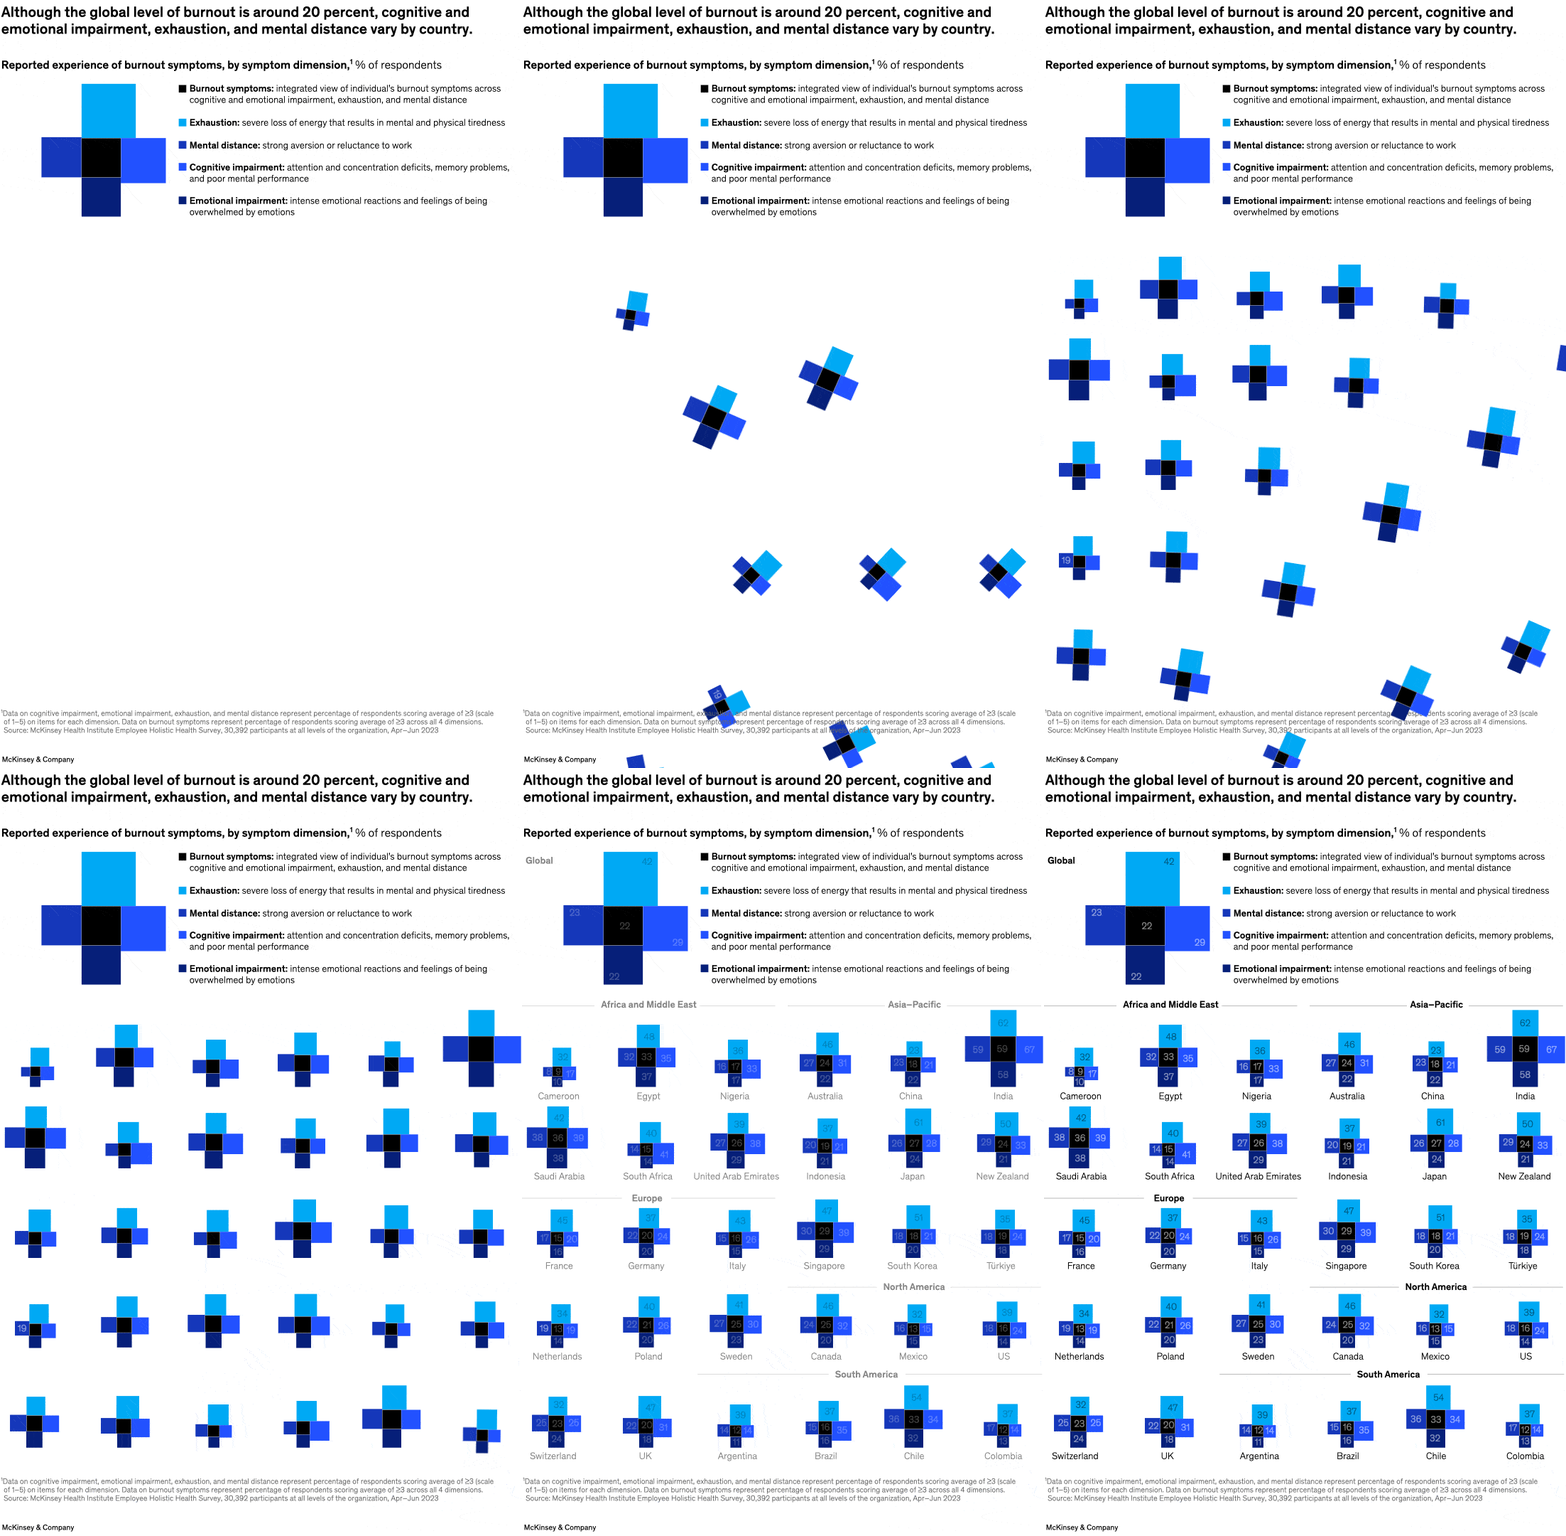
Multi-panel symptom map built from small cross-shaped mini charts. Each country is represented by a compact four-direction layout around a central burnout value, making the chart a matrix of repeated symptom profiles.
Layout / body structure
The display starts with one global reference pattern at the top and then breaks into grouped country grids by region beneath it. Reader moves from the global shape to the country small multiples, scanning left to right within regions and then region by region down the page.
What is being compared
The visual compares burnout symptoms across countries and across symptom dimensions. For each country it shows the integrated burnout measure in the center and the surrounding measures for exhaustion, mental distance, cognitive impairment, and emotional impairment.
Measurement system
The values are percentages of respondents. Each country mini chart prints the numeric value in the center and on the four directional arms, so the reader compares symptom levels by position rather than by a shared axis line.
Visible structure inside the graphic
The central black square in each mini chart holds the integrated burnout score, while the colored arms around it show the four symptom dimensions. Repeating the same cross-shaped geometry for every country makes the chart read like a map of symptom signatures rather than a standard table of numbers.
Main takeaway from the visual
Global burnout sits around one-fifth of respondents, but the underlying symptom profile differs materially by country. The country small multiples make that variation visible by showing some places with especially high exhaustion, others with stronger mental-distance or emotional-impairment readings, and different combinations of those symptoms around similar or different center scores.
Key standout values or extremes
The global reference shows 22 percent integrated burnout at the center, with 42 percent exhaustion, 29 percent cognitive impairment, 23 percent mental distance, and 22 percent emotional impairment around it. India stands out with very high outer values including 62 percent exhaustion, 67 percent cognitive impairment, and a 59 percent central burnout score, while countries such as the United States sit much lower in the center at 16 percent.
Controls / sequence, when applicable
This is a static chart image with no in-chart controls to operate.
Companion media, when applicable
There is no separate companion audio or video; the chart image is the full visual on this page.