Source page: McKinsey & Company
Commentary
Gathering energy
Renewable energy | Sustainability
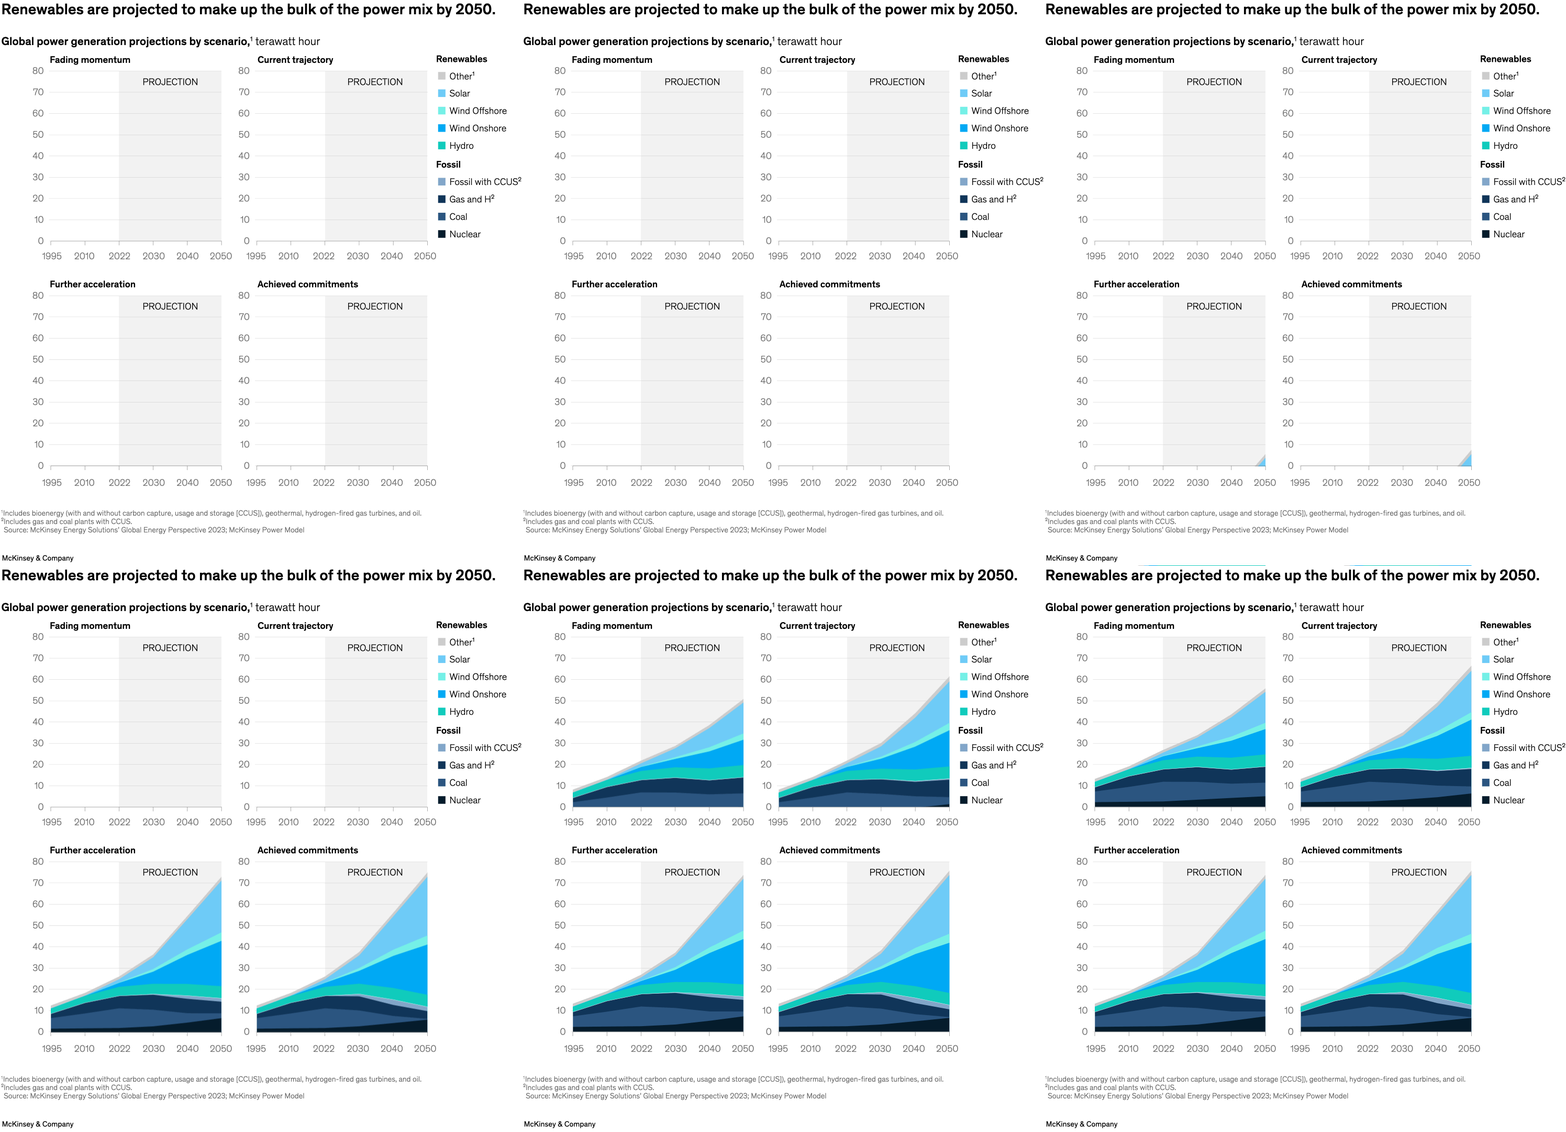
November 16, 2023 – Renewable energy has been growing rapidly and is becoming increasingly cost-competitive. McKinsey’s Global Energy Perspective 2023 projects that renewable-energy sources will account for between 45 and 50 percent of global generation by 2030, and between 65 and 85 percent by 2050. Solar power, followed by wind, will be the biggest contributors. However, the growth of renewables could face challenges, including supply chain issues and slow permitting.
To read the report, see “Global Energy Perspective 2023,” October 18, 2023.
customizer here
Visual form
Four-panel stacked area chart. Each panel shows how the global power mix evolves under a different scenario, with generation sources layered over time.
Layout / body structure
The chart is arranged as a two-by-two grid read left to right and then top to bottom. The four scenarios are fading momentum, current trajectory, further acceleration, and achieved commitments, and each one uses the same time axis so the scenario shapes can be compared directly.
What is being compared
The visual compares projected global power-generation mixes by scenario from the present through 2050. It compares how much of the total mix comes from renewables such as solar and wind versus other sources including fossil fuel categories across four different transition speeds.
Measurement system
The vertical scale shows share of global power generation, and the horizontal scale runs over time toward 2050. Color bands distinguish the different generation sources, so the reader tracks both the expanding total share of renewables and the shrinking share of other fuels under each scenario.
Visible structure inside the graphic
Each scenario panel is built from layered color bands that widen or narrow over time. The repeated stacked-area format is what makes the scenario comparison work, because the reader can see the same source categories taking radically different shares depending on whether the transition slows, stays on its current path, accelerates, or fully meets commitments.
Main takeaway from the visual
Renewables become the dominant part of the power mix in every scenario, but the extent and speed of that dominance vary sharply. The grid shows the highest renewable share in the achieved-commitments panel, a smaller but still dominant outcome in current trajectory, and a slower build in fading momentum.
Key standout values or extremes
The source range states that renewables reach roughly 45 to 50 percent of global generation by 2030 and between 65 and 85 percent by 2050. The achieved-commitments panel visually pushes the renewable bands closest to the upper end of that range, while fading momentum leaves a visibly larger residual share for other sources.
Controls / sequence, when applicable
This is a static chart image with no in-chart controls to operate.
Companion media, when applicable
There is no separate companion audio or video; the chart image is the full visual on this page.