Source page: McKinsey & Company
Commentary
EVs charge up
Automotive | Electric vehicles
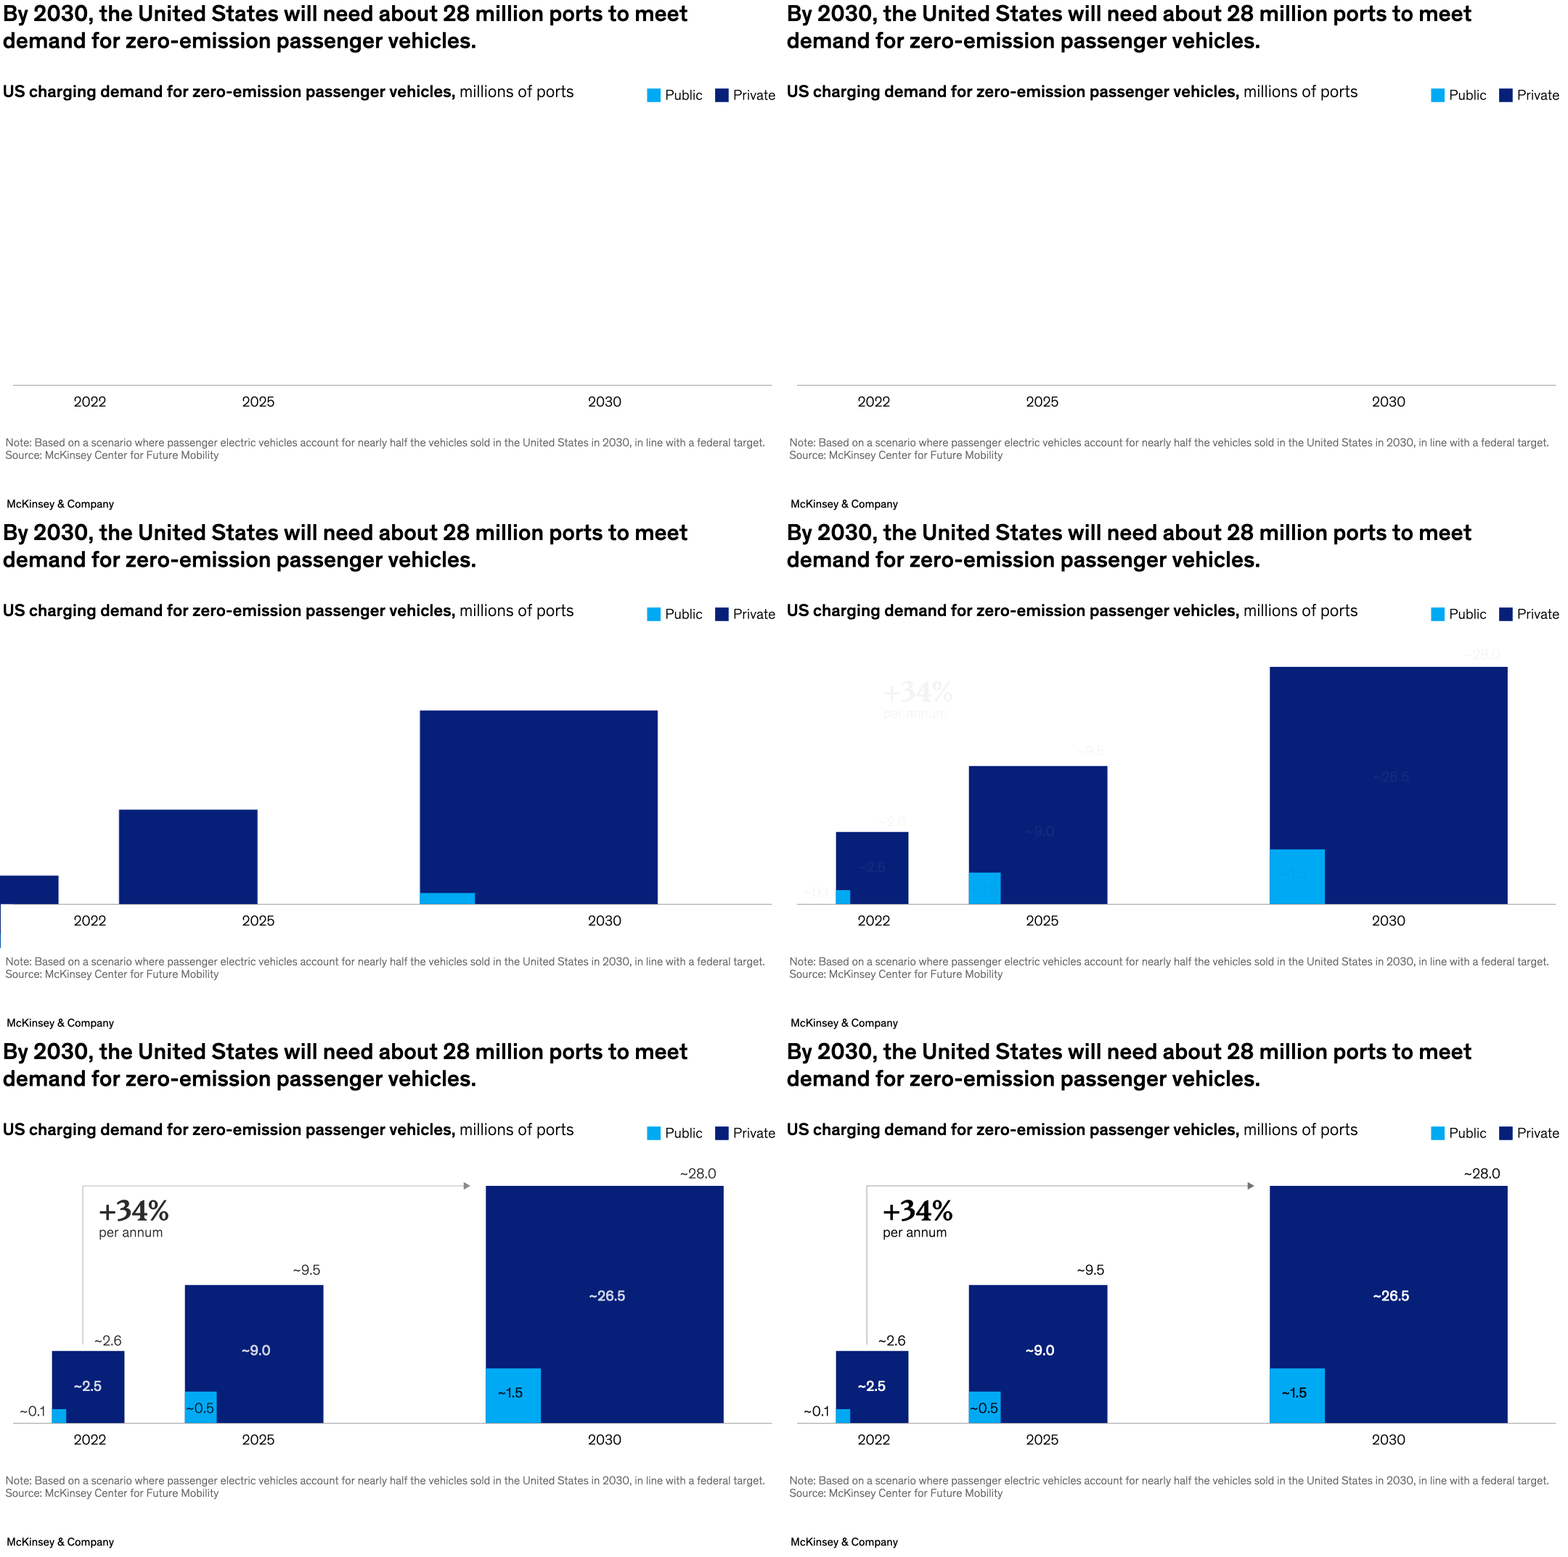
November 14, 2023 – Electric vehicles (EVs) accounted for about 8 percent of all new passenger cars sold in the United States last year, a record amount. By 2030, 53 percent of US cars could be EVs. By then, partner Shivika Sahdev and colleagues estimate, the United States will need about 28 million ports to meet the increased demand for battery juice. Private ports are expected to increase in number from approximately 2.5 million to nearly 27.0 million by 2030, representing about 95 percent of the total.
To read the article, see “Can public EV fast-charging stations be profitable in the United States?,” October 5, 2023.
customizer here
Visual form
Stacked column chart. The three columns show projected US charging-port demand across time, split into public and private ports.
Layout / body structure
The chart is built as a simple left-to-right sequence for 2022, 2025, and 2030. Each bar stacks the public charging layer on top of the much larger private charging layer, and a growth annotation above the bars summarizes the annual expansion rate.
What is being compared
The chart compares total charging-port demand for zero-emission passenger vehicles across three time points in the United States. It also compares the composition of that demand between public infrastructure and private ports.
Measurement system
The values are measured in millions of ports. The bar labels show the approximate public and private counts within each year, and the growth note indicates the pace at which total demand is projected to increase over the period.
Visible structure inside the graphic
The chart uses three stacked columns with a light public segment and a dark private segment, plus an arrow noting roughly 34 percent annual growth. The dramatic increase in overall column height from 2022 to 2030 makes the demand surge visible immediately.
Main takeaway from the visual
Charging demand rises steeply and is dominated by private ports rather than public ones. The stacked bars make that clear because the private portion accounts for most of the height in every year and grows to the overwhelming majority of the total by 2030.
Key standout values or extremes
The chart shows roughly 2.6 million total ports in 2022, around 9.5 million by 2025, and about 28 million by 2030. In the 2030 column, the split is about 26.5 million private ports versus about 1.5 million public ports, reinforcing the dominance of private charging in the total.
Controls / sequence, when applicable
This is a static chart image with no in-chart controls to operate.
Companion media, when applicable
There is no separate companion audio or video; the chart image is the full visual on this page.