Source page: McKinsey & Company
Commentary
Net zero’s green premium
Sustainability | Decarbonization
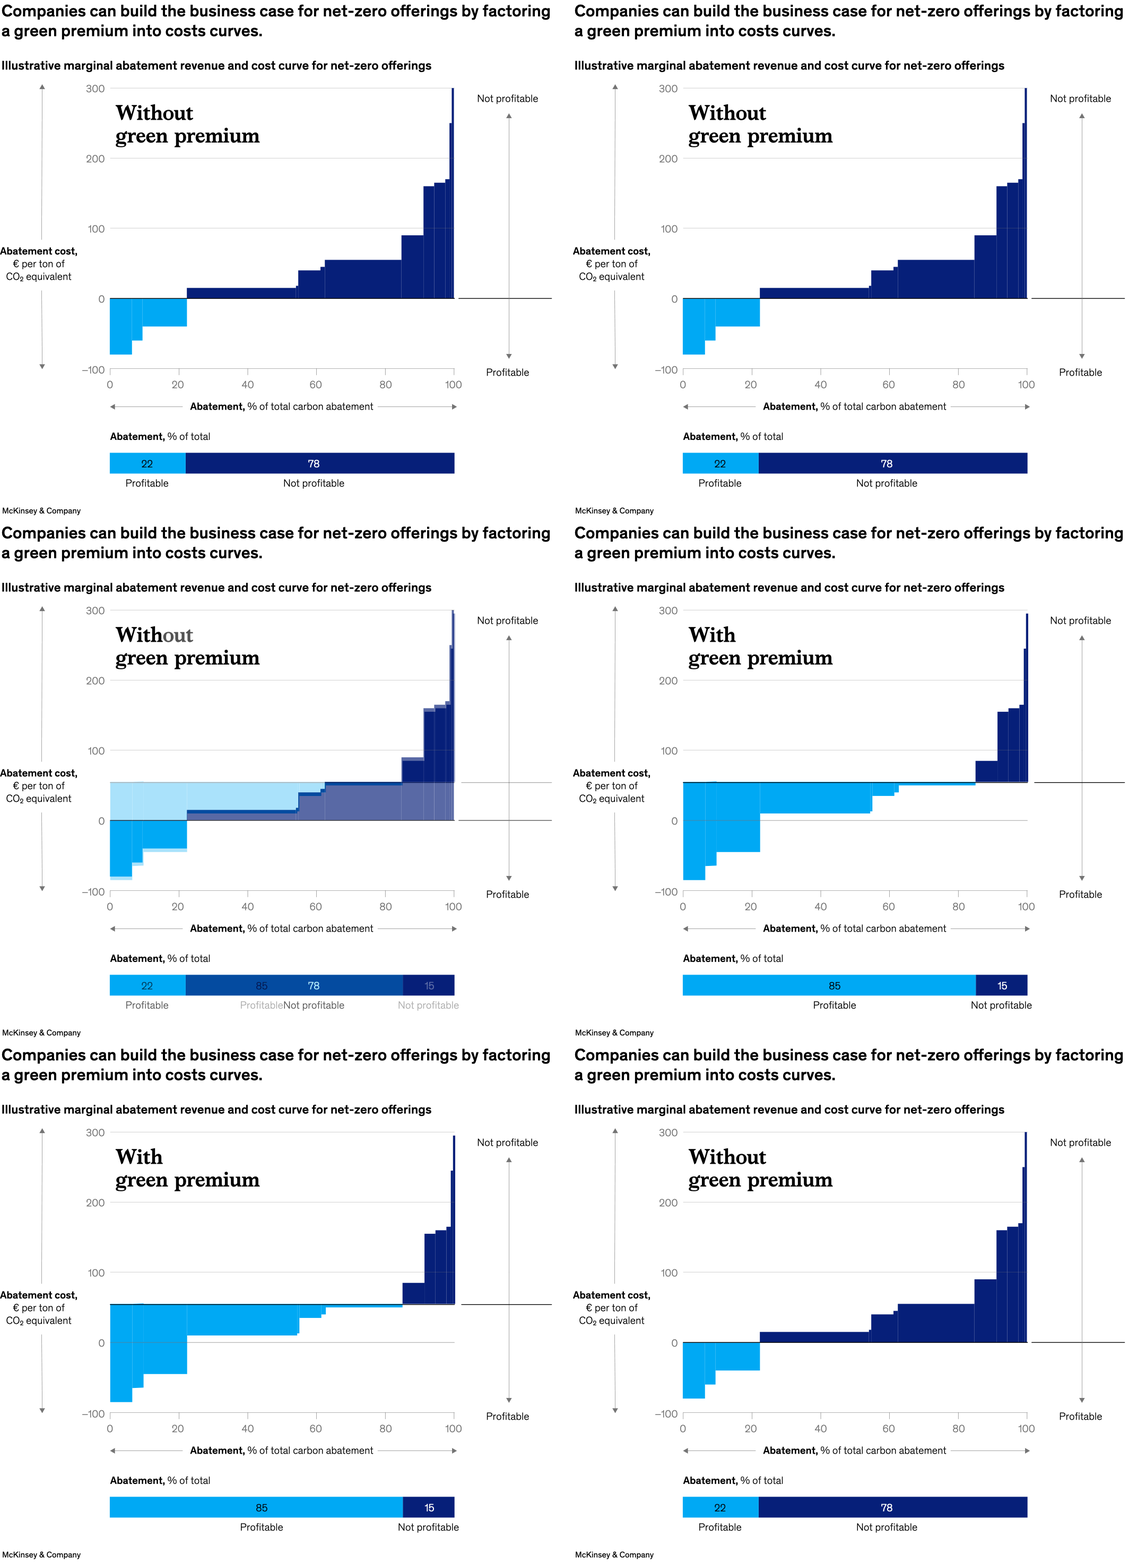
November 9, 2023 – Demand for net-zero offerings continues to surge. However, the costs for launching low-carbon products can run high. According to senior partner Philipp Radtke and coauthors, one way companies can build the business case for net-zero offerings is to include a price premium in cost curves—to reflect the potential revenue upside of in-demand green goods and services.
To read the article, see “Decarbonize and create value: How incumbents can tackle the steep challenge,” October 24, 2023.
customizer here
Visual form
Marginal-abatement cost curve. The chart uses stepped bars above and below a zero line to show which portions of carbon abatement are profitable and which remain unprofitable without a green premium.
Layout / body structure
The chart is laid out as one horizontal cost curve read left to right as abatement share increases toward 100 percent. A summary strip beneath the main curve restates the split between profitable and not profitable abatement, so the page reads top to bottom from detailed curve to total share split.
What is being compared
The visual compares the cost of successive slices of carbon abatement within a net-zero offering portfolio. It contrasts abatement opportunities that sit below zero cost with those that require positive cost and therefore need either a premium or another value driver to become attractive.
Measurement system
The vertical measure is abatement cost in euros per ton of CO2 equivalent, and the horizontal measure is abatement as a percentage of total carbon abatement. Position relative to the zero line is the crucial measurement cue because it separates profitable from unprofitable portions of the curve.
Visible structure inside the graphic
The curve starts with a small group of light blue steps below zero and then transitions into a long run of dark blue steps above zero that climb sharply at the far right. A side label marks the upper region as not profitable and the lower region as profitable, while the lower strip summarizes the split in total abatement share.
Main takeaway from the visual
Most abatement is not profitable if companies do not factor in a green premium. The chart makes that visible by placing only a small early portion of the curve below zero and leaving the majority of the abatement steps above zero, with the highest-cost slices concentrated at the far right.
Key standout values or extremes
The bottom summary bar shows that only 22 percent of abatement is profitable and 78 percent is not profitable in the no-green-premium case. On the cost scale, the rightmost steps rise toward about 300 euros per ton, while the profitable steps sit down in the negative-cost range near minus 100 to zero.
Controls / sequence, when applicable
This is a static chart image with no in-chart controls to operate.
Companion media, when applicable
There is no separate companion audio or video; the chart image is the full visual on this page.