Source page: McKinsey & Company
Commentary
Clean energy is so metal
Metals and mining | Sustainability
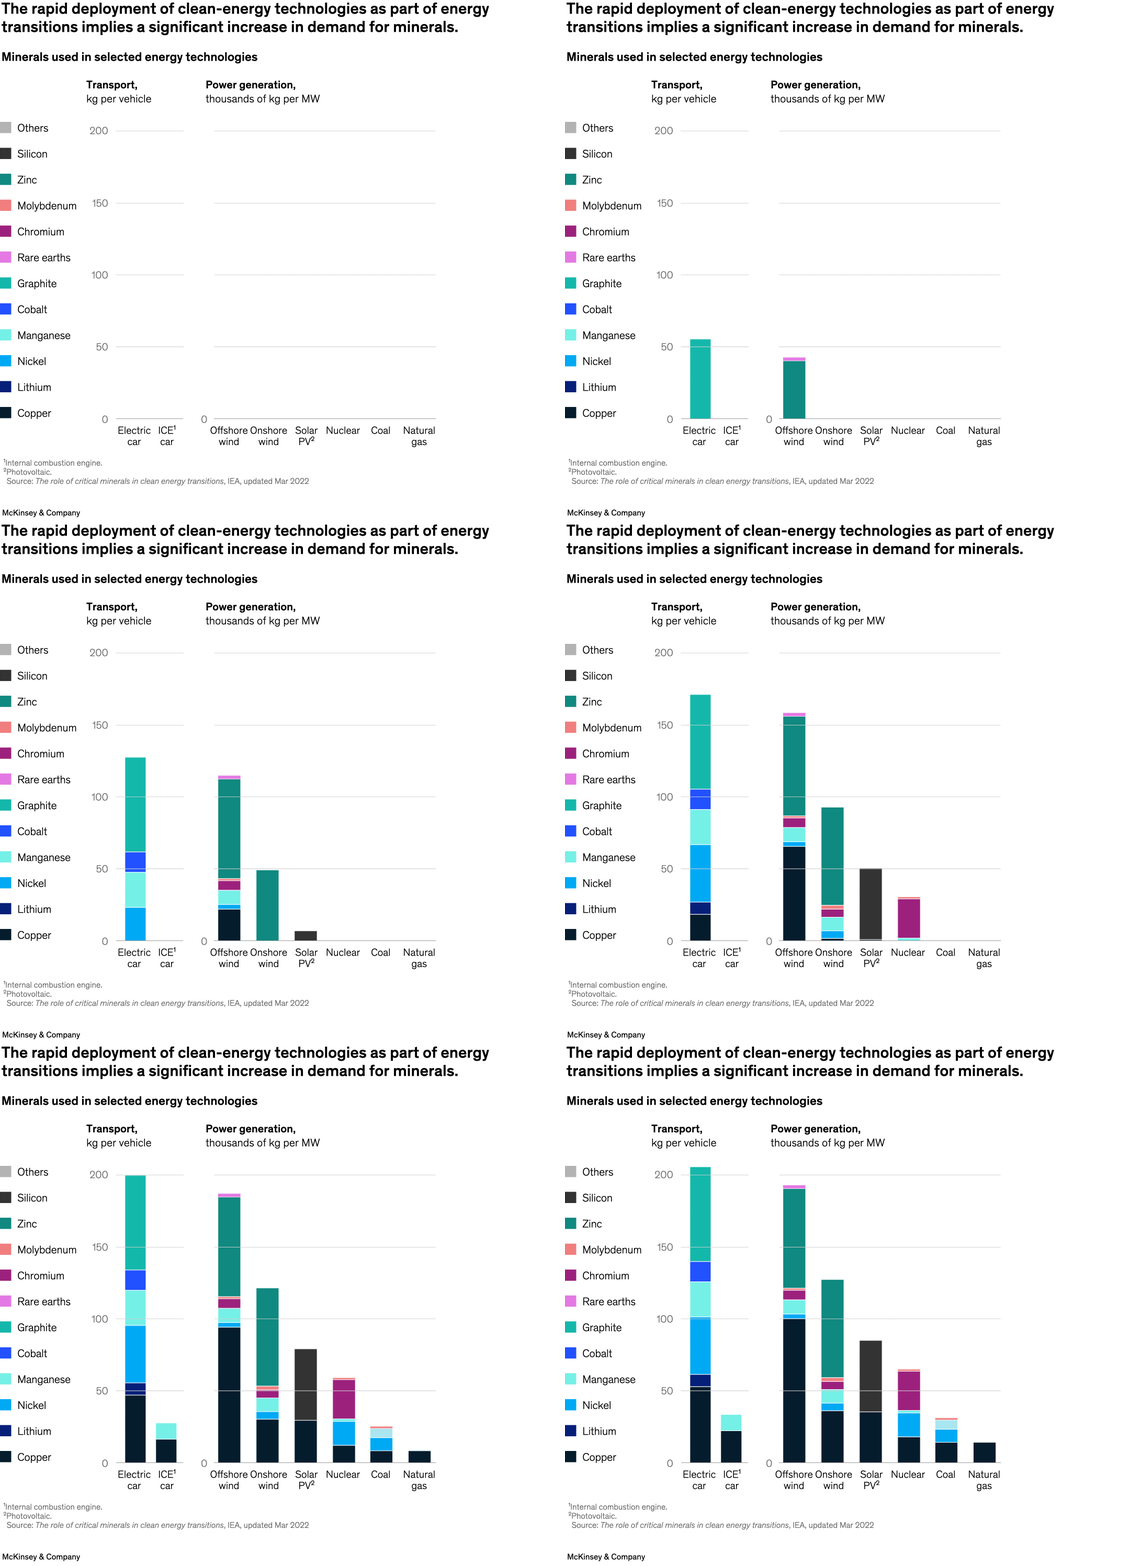
November 1, 2023 – Achieving net-zero emissions by 2050 will require a transition to cleaner energy sources. Metals and minerals will be in greater demand since low-carbon technologies often require more of these materials than conventional energy sources, partner Roland Rechtsteiner and coauthors note. For instance, by 2030, battery electric vehicles and the charging infrastructures they rely upon will consume as much as 50 percent of rare earth elements, 55 percent of cobalt, and 36 percent of nickel.
To read the article, see “The trading opportunity that could create resilience in materials,” September 26, 2023.
customizer here
Visual form
Paired stacked bar chart. The left side compares transport technologies by kilograms of minerals per vehicle, and the right side compares power-generation technologies by thousands of kilograms of minerals per megawatt.
Layout / body structure
The chart is split into two major sections read left to right: transport on the left and power generation on the right. Within each section, stacked bars show how different minerals contribute to the total material intensity of each technology.
What is being compared
The visual compares the mineral requirements of electric versus internal-combustion vehicles and of power technologies including offshore wind, onshore wind, solar PV, nuclear, coal, and natural gas. It is comparing both total mineral intensity and the internal mineral mix for each technology.
Measurement system
The left side uses kilograms per vehicle, and the right side uses thousands of kilograms per megawatt. Color encodes the mineral categories, so the reader can see both how tall the overall bar is and which materials make up the total.
Visible structure inside the graphic
Each technology is represented by a stacked vertical bar made of many colored mineral layers such as copper, lithium, nickel, cobalt, graphite, rare earths, and others. The two-section layout makes it easy to compare the overall mass required for transport technologies against the much larger absolute requirements for some power technologies.
Main takeaway from the visual
Clean-energy technologies are materially more mineral-intensive than many conventional alternatives. The chart makes that visible by showing the electric-car bar towering above the internal-combustion bar and by showing offshore and onshore wind with much taller mineral stacks than coal or natural gas.
Key standout values or extremes
The electric-car bar rises a little above 200 kilograms per vehicle, compared with roughly 30 kilograms for the internal-combustion car. On the power side, offshore wind is the tallest bar at just under 200 thousand kilograms per megawatt, onshore wind follows at roughly 125, solar PV sits around the mid-80s, and coal and natural gas are far lower.
Controls / sequence, when applicable
This is a static chart image with no in-chart controls to operate.
Companion media, when applicable
There is no separate companion audio or video; the chart image is the full visual on this page.