Source page: McKinsey & Company
Commentary
Deadline to spend school dollars
Education | Public Sector
October 31, 2023 – US federal funds totaling $90 billion remain on the table for K–12 schools, and they need to move quickly to spend it. Partner Jake Bryant and colleagues explain that US public schools have spent about $2.7 billion a month so far from the Elementary and Secondary School Emergency Relief Fund. Schools will need to spend or decide how to allocate approximately $5 billion per month through September 2024 to use the rest before the funds expire.
To read the article, see “Stimulus funding deadlines loom: How are K–12 schools adjusting their priorities?,” September 22, 2023.
customizer here
Visual form
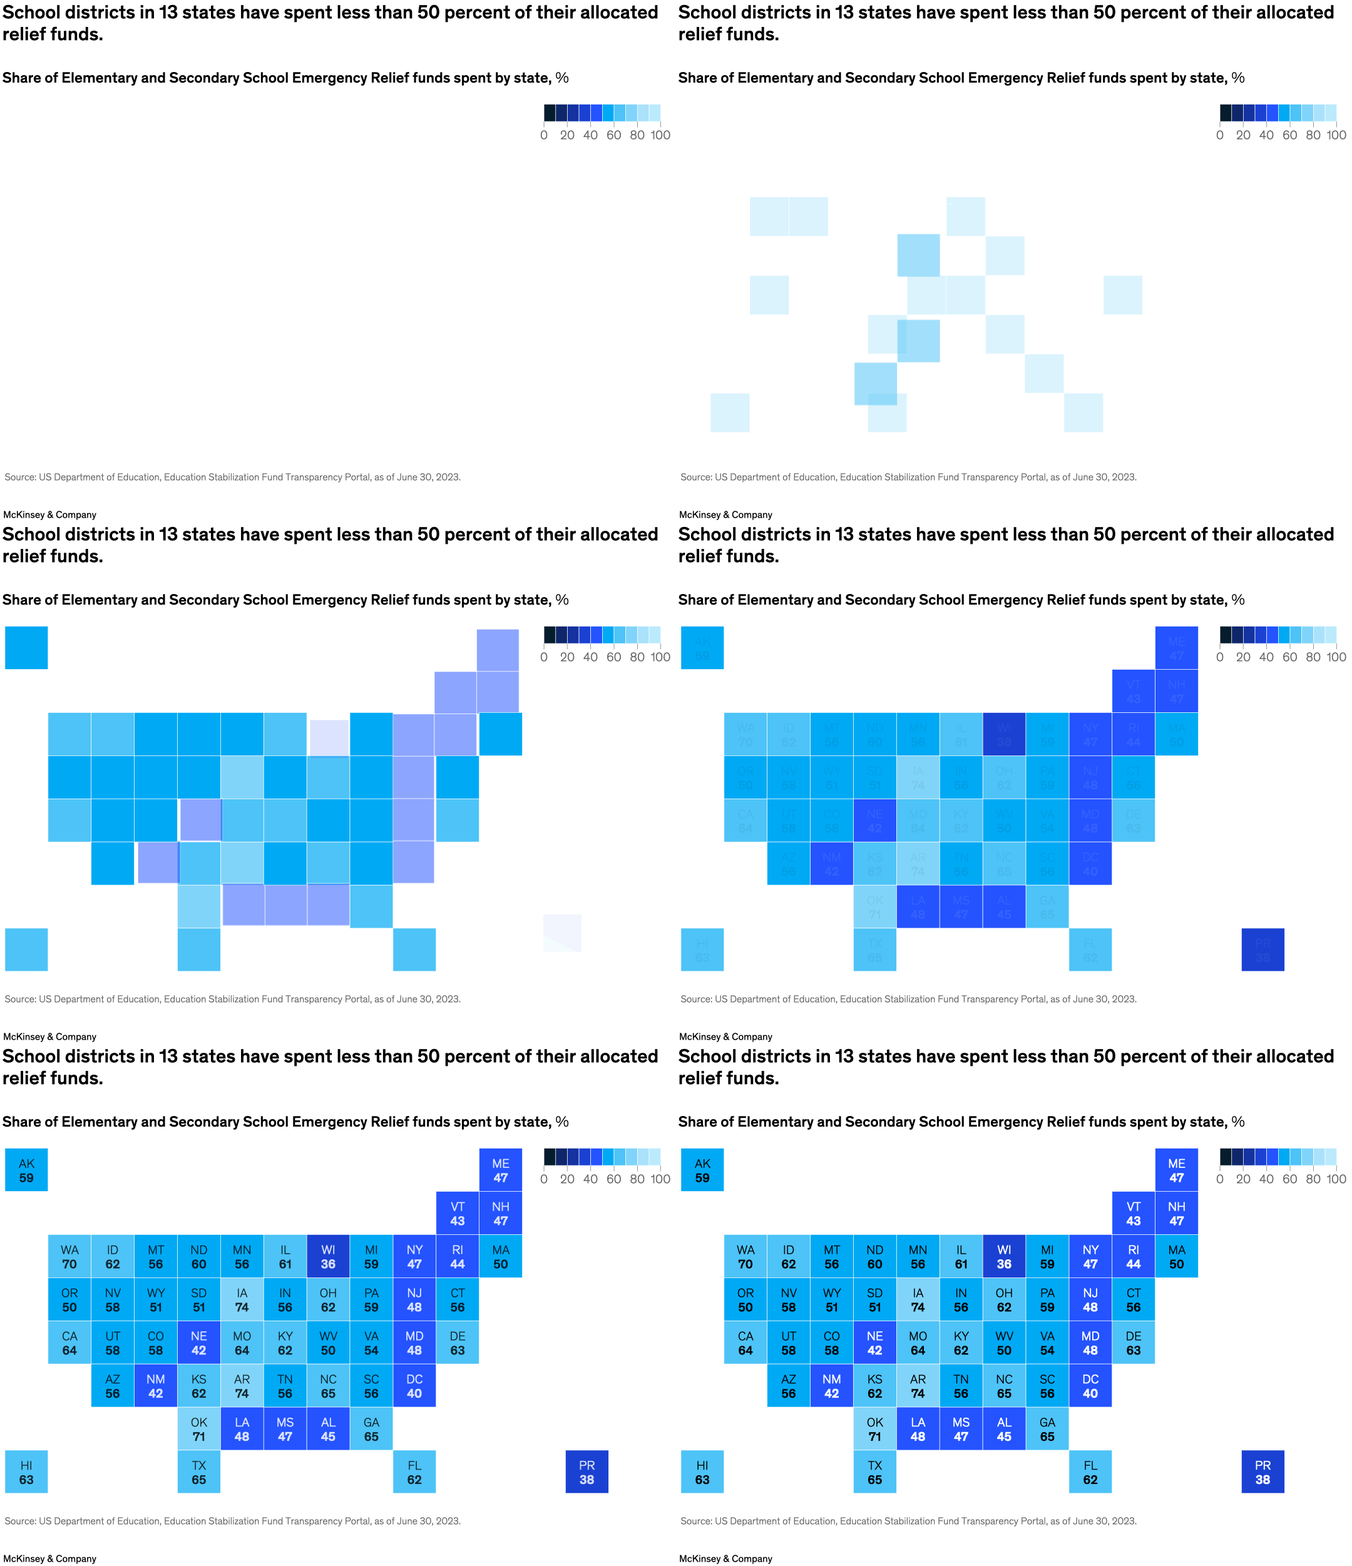
Tile-map choropleth. The visual arranges states as labeled boxes and uses color shading to show the share of emergency-relief funds already spent.
Layout / body structure
The page presents a national tile map with each state shown as a square or rectangle in an approximate US layout, plus a legend in the upper right. Reader moves across the map looking for darker low-spend states and lighter higher-spend states rather than following a ranked list.
What is being compared
The visual compares the share of Elementary and Secondary School Emergency Relief funds spent by state. It is comparing state-by-state spending progress and making it easy to spot which places are still below the 50 percent threshold.
Measurement system
The unit is percentage of allocated funds spent. Each tile contains the exact state abbreviation and percentage, while the color scale from darker blue to lighter blue indicates lower to higher spending completion.
Visible structure inside the graphic
The chart uses one labeled tile per state, with separate tiles for Alaska, Hawaii, and Puerto Rico. The legend provides the color ramp, and the tile positions are organized in a geographic-style arrangement so regional clusters of slower or faster spending become visible.
Main takeaway from the visual
A large set of states are still below the halfway-spent mark, and the slowest spenders cluster in some parts of the Northeast and South as well as in Puerto Rico. The tile-map format makes the lagging states easy to pick out because their darker tiles and lower printed percentages stand out against the many states in the 50s, 60s, and 70s.
Key standout values or extremes
Puerto Rico is the lowest value shown at 38 percent, while Wisconsin is at 36 percent, DC at 40 percent, Nebraska and New Mexico at 42 percent, Vermont at 43 percent, Rhode Island at 44 percent, and Alabama at 45 percent. At the high end, Iowa and Arkansas both show 74 percent, and Oklahoma reaches 71 percent.
Controls / sequence, when applicable
This is a static chart image with no in-chart controls to operate.
Companion media, when applicable
There is no separate companion audio or video; the chart image is the full visual on this page.