Source page: McKinsey & Company
Commentary
Financial performance may vary
Banking | Financial services
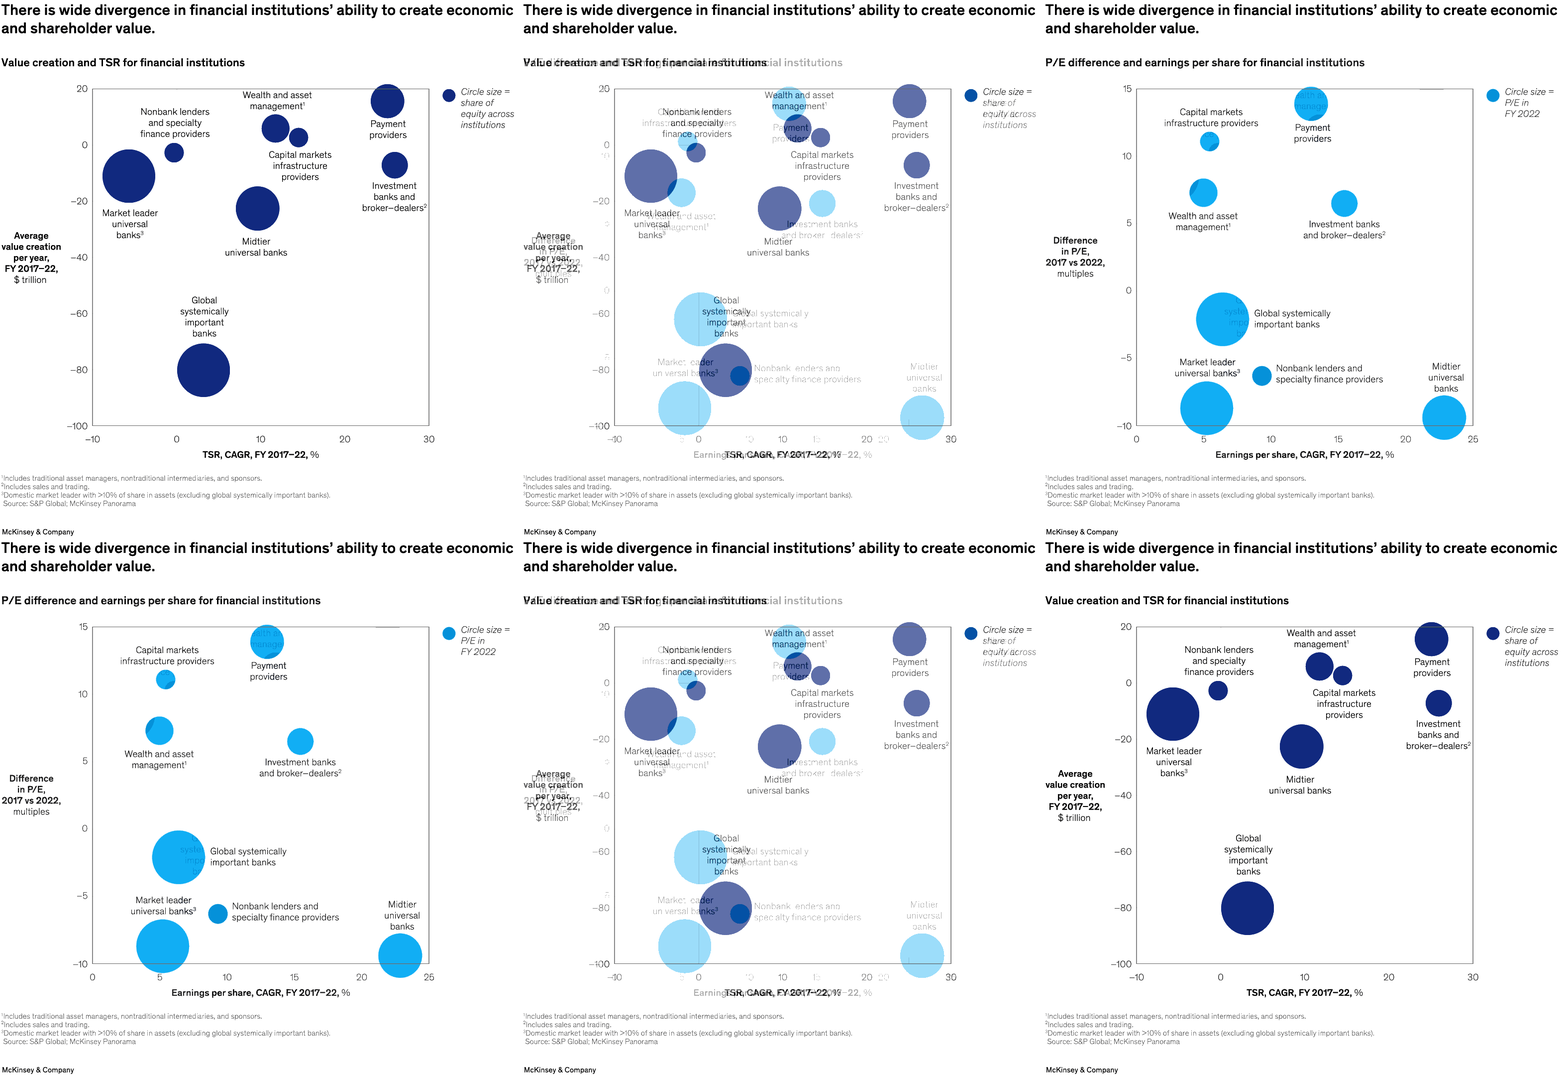
October 27, 2023 – Banking institutions have been on a wild ride in recent years, and their performance has varied depending on the type of institution. For example, according to senior partner Miklós Dietz and coauthors, payment providers, capital market infrastructure providers, and asset managers are among the categories that increased their price to earnings between 2017 and 2022, while other categories, including universal banks and nonbank lenders, saw a decline. Strong performers tend to use the balance sheet effectively, are customer centric, and lead on technology.
To read the report, see “Global Banking Annual Review 2023: The Great Banking Transition,” October 10, 2023.
customizer here
Visual form
Bubble scatter plot. Each bubble represents a type of financial institution.
Layout / body structure
It is a single chart with a horizontal axis, a vertical axis, and labeled circles spread across the field. The eye reads the plot by locating each bubble’s position and then checking the size legend at the upper right.
What is being compared
It compares categories such as payment providers, wealth and asset managers, capital markets infrastructure providers, nonbank lenders and specialty finance providers, market leader universal banks, midtier universal banks, investment banks and broker-dealers, and global systemically important banks.
Measurement system
The x-axis tracks TSR CAGR for fiscal years 2017 to 2022 in percent, the y-axis tracks average value creation per year in dollar terms, and circle size represents share of equity across institutions.
Visible structure inside the graphic
The chart uses labeled bubbles, a size legend, and a spread across positive and negative territory to separate winners from laggards. Bubbles in the upper-right combine stronger shareholder returns with positive value creation, while bubbles lower on the chart show weaker or negative value creation.
Main takeaway from the visual
The plot shows a wide split between financial-institution types rather than one tight cluster. Payment providers, wealth and asset management, and capital markets infrastructure sit in clearly stronger territory, while several bank categories sit at or below zero on value creation.
Key standout values or extremes
Payment providers sit furthest to the right at roughly 25 percent TSR CAGR and in positive value-creation territory. Global systemically important banks fall deepest down the chart at about minus 80 on the y-axis, and market leader universal banks form one of the largest circles while still sitting below zero.
Controls / sequence, when applicable
This is a static chart image with no in-chart controls to operate.
Companion media, when applicable
There is no separate companion audio or video; the chart image is the full visual on this page.