Source page: McKinsey & Company
Commentary
Fab sustainability
Semiconductors | Decarbonization
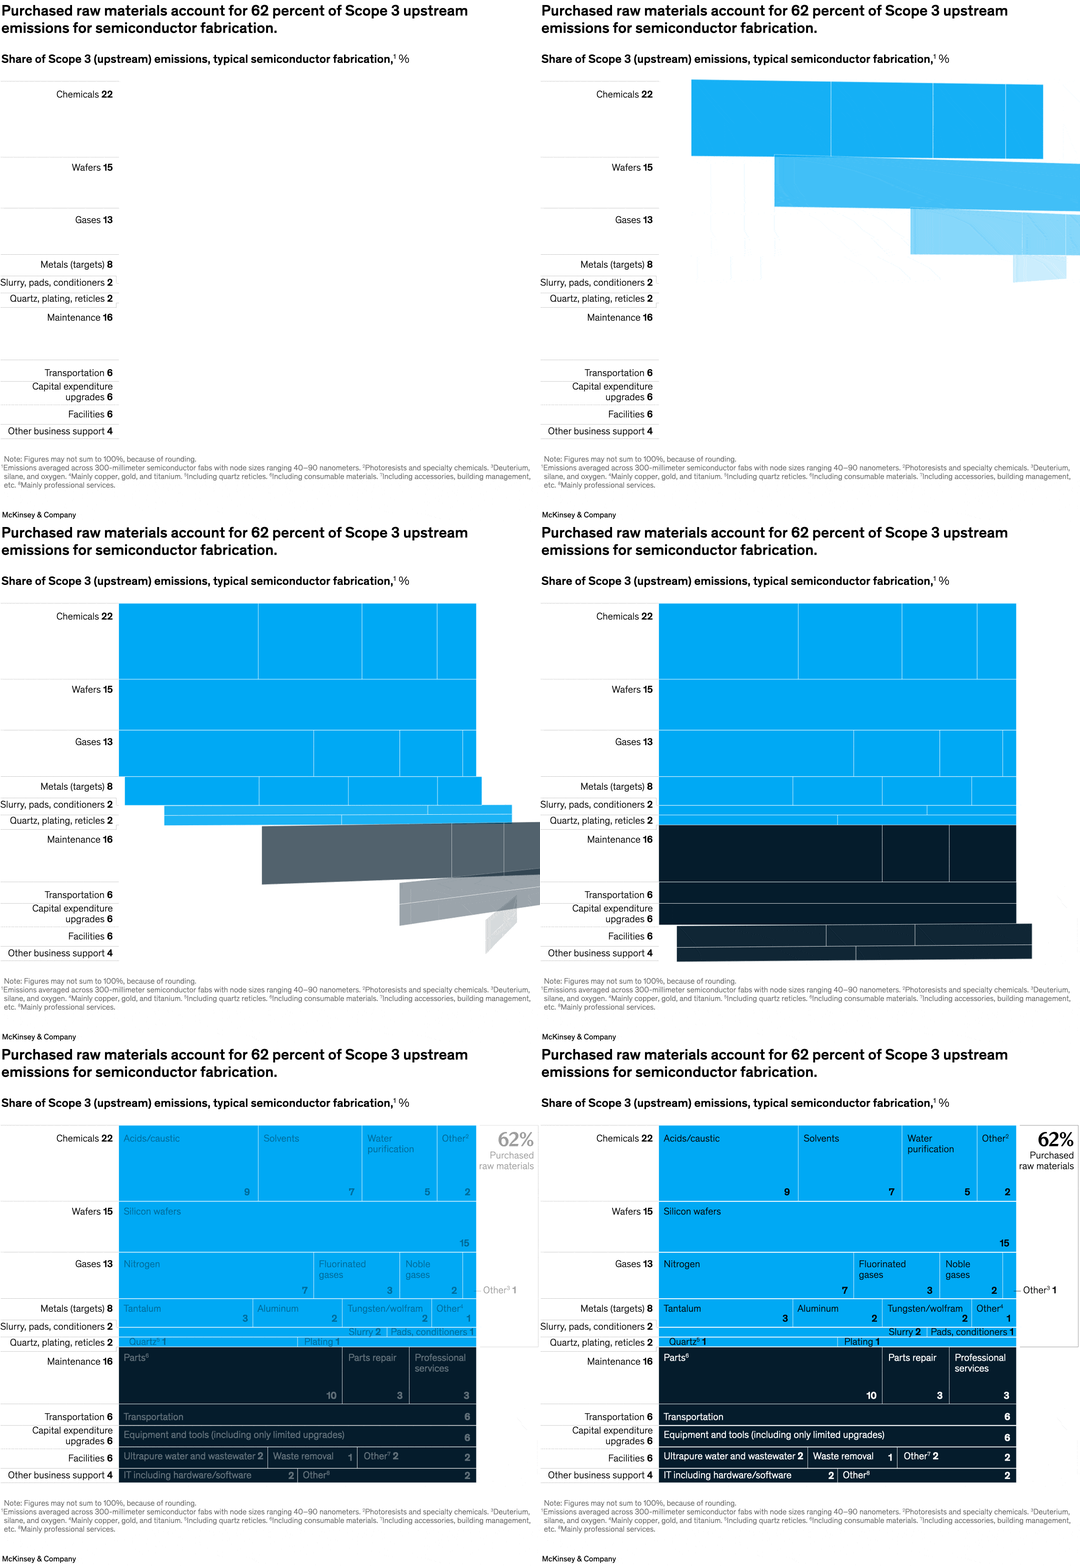
October 25, 2023 – Decarbonizing supplier emissions has emerged as a priority for semiconductor manufacturers. According to senior partner Mark Patel and colleagues, purchased materials—from chemicals to silicon wafers—account for 62 percent of Scope 3 upstream emissions (or, those originating from suppliers). Semiconductor players can look to reduce supplier emissions by redesigning or enhancing product specifications and optimizing use of materials, among other measures.
To read the article, see “Beyond the fab: Decarbonizing Scope 3 upstream emissions,” October 9, 2023.
customizer here
Visual form
Ranked categorical breakdown chart with horizontal value markers rather than a time series. It reads like a decomposition of one total into supplier-side sources.
Layout / body structure
The visual is a single top-to-bottom list of upstream emissions sources, with each category labeled on the left and its percentage shown at the end of its row. It reads from the largest contributor at the top down to progressively smaller contributors.
What is being compared
It compares the share of Scope 3 upstream emissions coming from different inputs and operating categories in a typical semiconductor fabrication footprint.
Measurement system
The numbers are percentages of total Scope 3 upstream emissions. The reader is tracking category shares rather than dollar values or time changes.
Visible structure inside the graphic
Each line item is separated into its own band, with a label and bold value, so the chart works like a ranked decomposition of the total. The list groups raw-material inputs near the top and smaller facility or support categories further down.
Main takeaway from the visual
The graphic shows that supplier-side materials dominate the emissions mix. The concentration at the top of the list makes it clear that the biggest decarbonization opportunity sits in purchased chemicals, wafers, gases, and metals rather than in the smaller support categories.
Key standout values or extremes
Chemicals lead at 22 percent, followed by maintenance at 16 percent, wafers at 15 percent, and gases at 13 percent. Metals account for 8 percent, transportation, capital expenditure upgrades, and facilities each sit at 6 percent, other business support is 4 percent, and the smallest items shown are slurry or pads or conditioners and quartz or plating or reticles at 2 percent each.
Controls / sequence, when applicable
This is a static chart image with no in-chart controls to operate.
Companion media, when applicable
There is no separate companion audio or video; the chart image is the full visual on this page.