Source page: McKinsey & Company
Commentary
Bang for your R&D bucks
Life Sciences | Healthcare | Technology
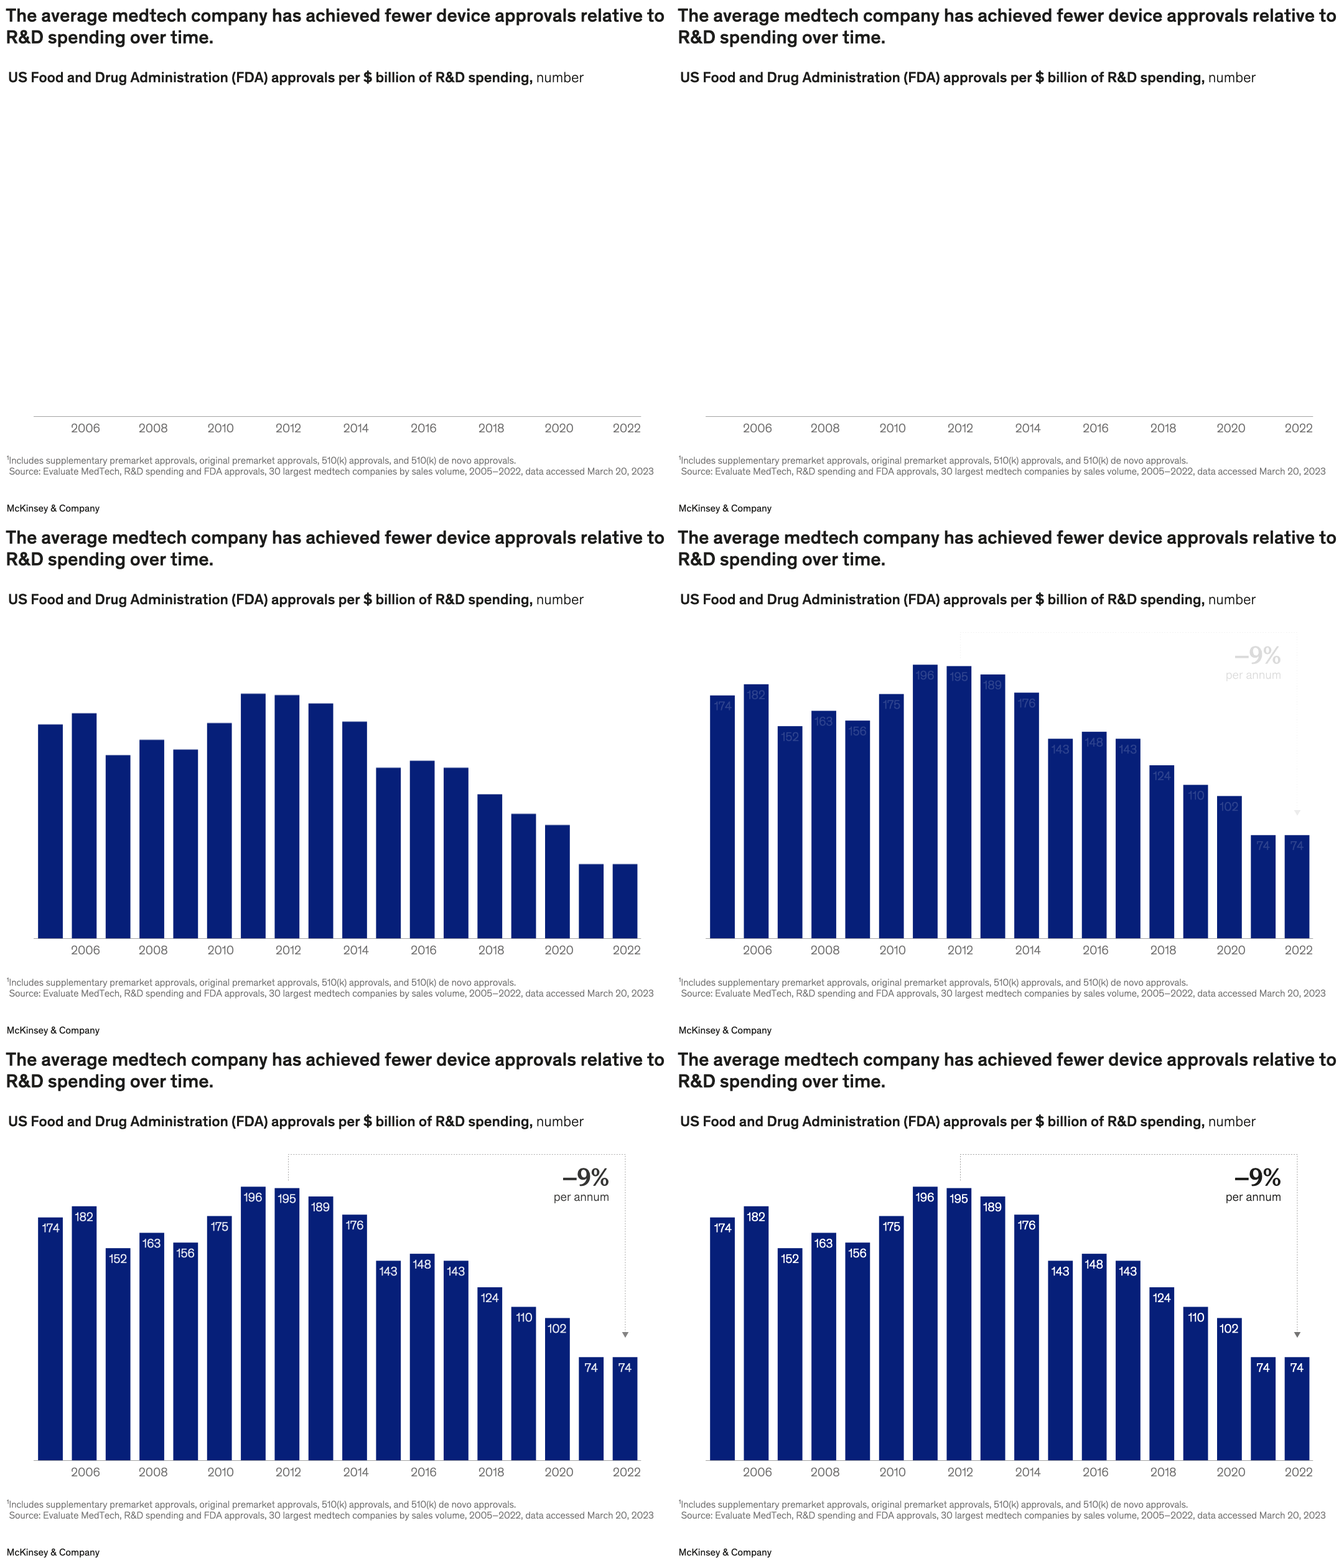
October 23, 2023 – There are opportunities for medtech players to make the most of R&D spending, find partner André Rocha and coauthors. For example, since 2011, the average number of US Food and Drug Administration device approvals per billion dollars spent on R&D for medtechs has declined by an average of 9 percent per year. Companies could look to boost capabilities such as product management, design thinking, and systems engineering.
To read the report, see “Medtech Pulse: Thriving in the next decade,” September 15, 2023.
customizer here
Visual form
Line chart. It tracks one efficiency measure across time.
Layout / body structure
The layout is a single chart with the line running from left to right across the years, with source notes tucked underneath. There is no second panel or side breakout.
What is being compared
It compares FDA device approvals against R and D spending efficiency over time for the average medtech company.
Measurement system
The x-axis covers the years 2006 through 2022, and the y measure is FDA approvals per billion dollars of R and D spending. The reader is tracking approvals-per-spend as a ratio, not total approvals or total spending by themselves.
Visible structure inside the graphic
The graphic centers on one time-series line stretched across the full period. The minimal layout keeps the focus on the direction of the curve rather than on multiple categories or segments.
Main takeaway from the visual
The line is built to show declining R and D productivity: companies are getting fewer approvals for each billion dollars they spend. The visual evidence is the downward movement from the left side of the period toward the right.
Key standout values or extremes
The clearest extreme is the gap between the early years, when approvals per billion dollars are visibly higher, and the far-right end of the chart, where the line sits materially lower by 2022. The chart emphasizes the decline across the whole period rather than one isolated spike.
Controls / sequence, when applicable
This is a static chart image with no in-chart controls to operate.
Companion media, when applicable
There is no separate companion audio or video; the chart image is the full visual on this page.