Source page: McKinsey & Company
Commentary
Liquidity lift
Banking | Financial services
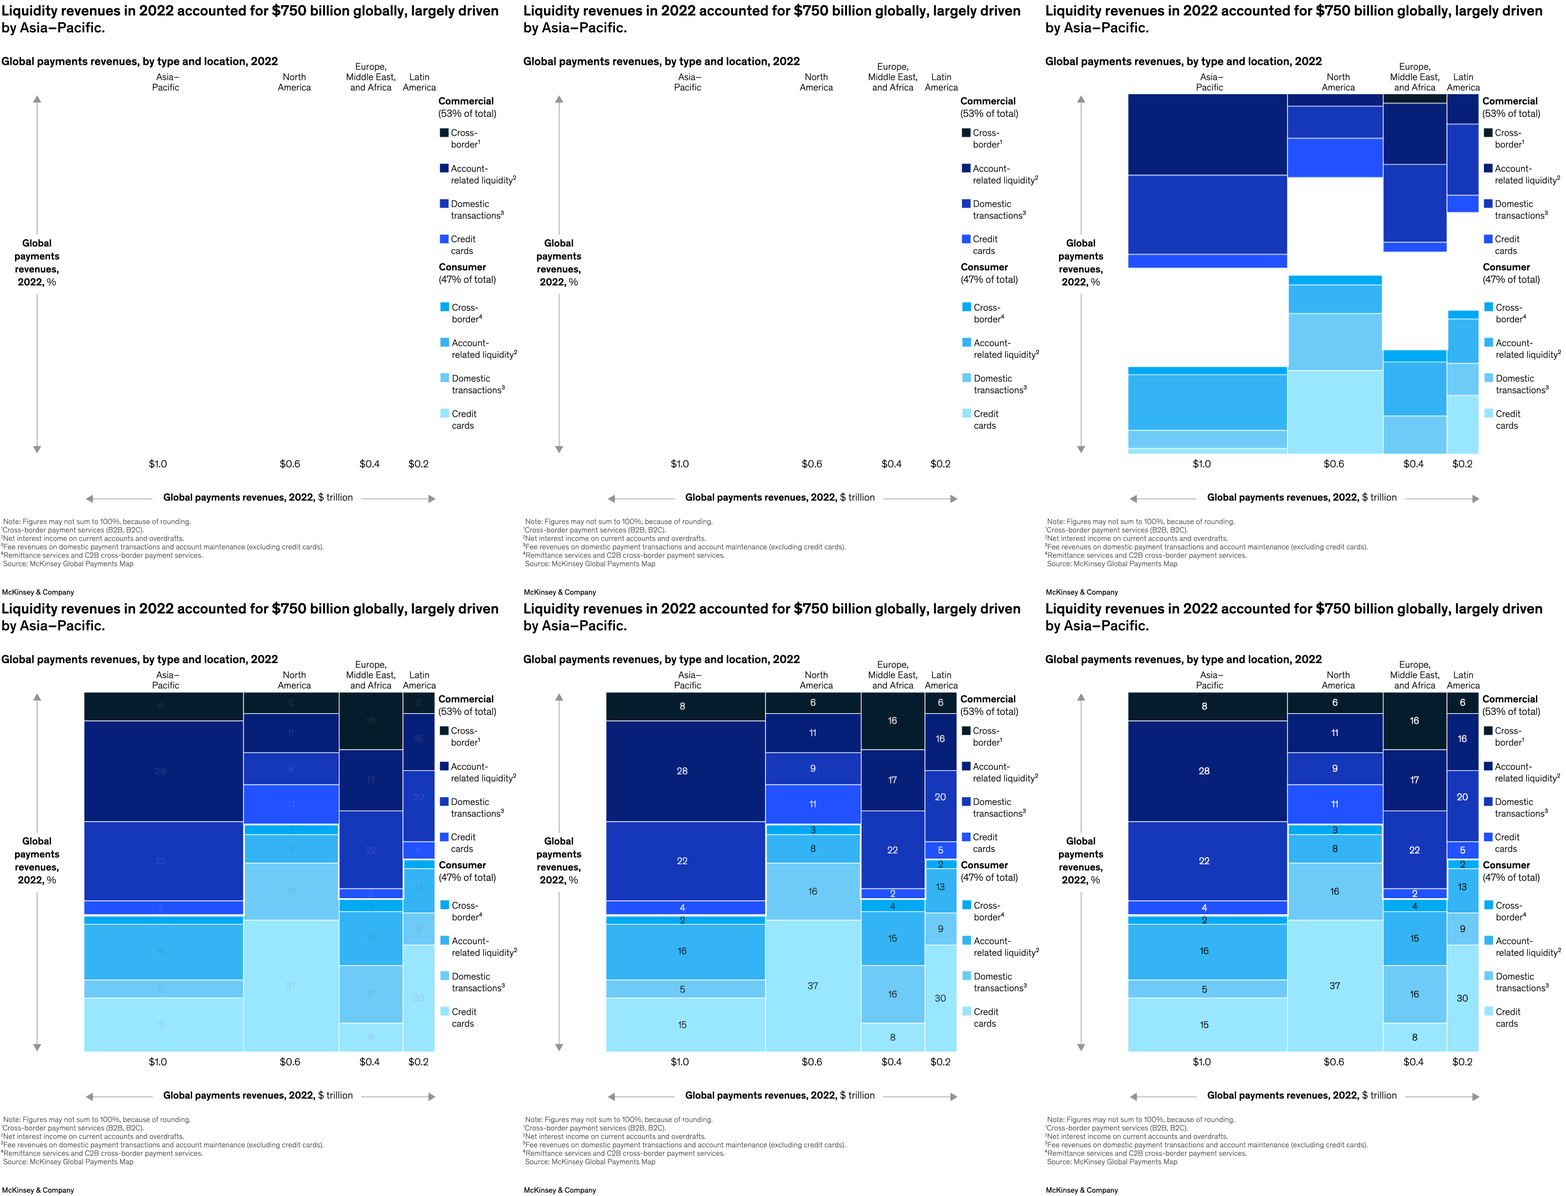
October 11, 2023 – Digital wallets and instant payments have helped to boost revenues for banks and other players in the payments industry. Liquidity revenues for 2022 reached $750 billion globally, senior partner Marie-Claude Nadeau and coauthors note. By region, Asia–Pacific led the way, driven largely by the commercial segment, at 63 percent, compared with 38 percent for consumer revenues. Cross-border transactions could be one of the biggest growth opportunities for the payments industry going forward.
To read the report, see “On the cusp of the next payments era: Future opportunities for banks,” September 18, 2023.
customizer here
Visual form
Multi-part revenue breakdown chart. It decomposes global payments revenues across regions and revenue types instead of using a single line or bar.
Layout / body structure
The chart spreads regions across the top, uses the left side to anchor the overall payments-revenue frame, and places the commercial and consumer type legend on the right. Reader moves across the graphic as a breakdown from total revenues into location and then into type.
What is being compared
It compares global payments revenues in 2022 by region and by type, separating Asia-Pacific, North America, Europe or Middle East or Africa, and Latin America, while also splitting commercial and consumer flows into cross-border, account-related liquidity, domestic transactions, and credit cards.
Measurement system
The chart uses 2022 dollar values in trillions for the regional revenue scale and percentage shares for the commercial-versus-consumer split. Color indicates revenue type across the legend.
Visible structure inside the graphic
The structure is a decomposition layout rather than a single axis plot: region labels run across the top, a total-revenue scale sits along the bottom, and the right-side legend breaks the mix into darker commercial shades and lighter consumer shades. That arrangement makes the reader trace how the revenue pool is distributed by both geography and product mix.
Main takeaway from the visual
Asia-Pacific is the main engine in this chart, and the liquidity-heavy commercial side is larger than the consumer side. The visual is designed to show concentration, with the largest regional weight sitting in Asia-Pacific and the commercial mix taking a bigger overall share.
Key standout values or extremes
The title highlights 750 billion dollars of global liquidity revenues in 2022, and the chart shows Asia-Pacific at the largest regional scale, around 1.0 trillion dollars of total payments revenue, versus roughly 0.6 for North America, 0.4 for Europe or Middle East or Africa, and 0.2 for Latin America. The legend also marks commercial at 53 percent of total versus consumer at 47 percent.
Controls / sequence, when applicable
This is a static chart image with no in-chart controls to operate.
Companion media, when applicable
There is no separate companion audio or video; the chart image is the full visual on this page.