Source page: McKinsey & Company
Commentary
Keeping the government humming
North America | Public Sector | Productivity
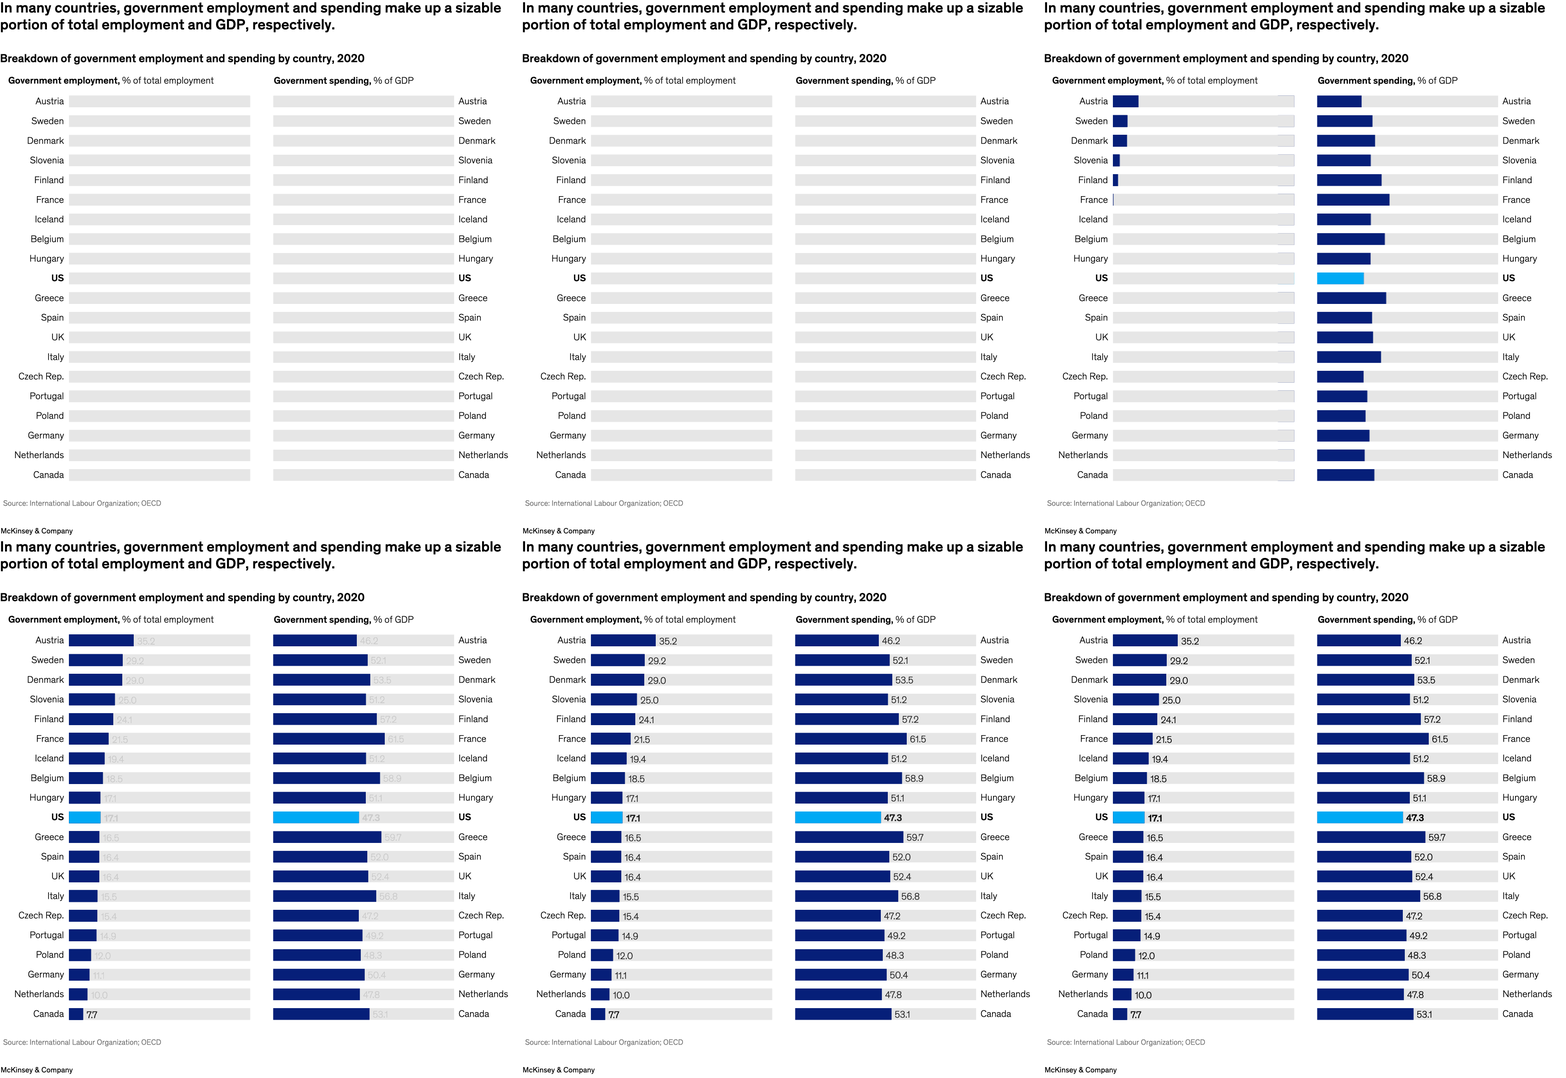
October 3, 2023 – For most countries, government represents the largest portion of the economy and is the biggest employer. In the United States, for example, government at all levels accounted for about 47 percent of GDP and about 17 percent of total employment in 2020. As governments emerge from the challenges of the COVID-19 pandemic, they could focus on productivity, find senior partner Shubham Singhal and coauthors. There’s a $725 billion to $765 billion opportunity in the United States to improve productivity—or, in other words, roughly $750 billion annually could be saved while keeping government services operating just as effectively.
To read the article, see “US government productivity: A more than $2,000 per resident opportunity,” September 5, 2023.
customizer here
Visual form
Paired ranked bar chart. It compares two government measures across countries on parallel lists.
Layout / body structure
The page lays out two horizontal-bar panels side by side: government employment as a share of total employment on the left and government spending as a share of GDP on the right. The countries line up across the two lists so the reader can compare rank positions across both measures.
What is being compared
It compares countries on government employment intensity and government spending intensity in 2020.
Measurement system
The left panel uses percent of total employment and the right panel uses percent of GDP. The values are ranked by country rather than shown as a time series.
Visible structure inside the graphic
Each country occupies one horizontal row across both panels, with matching order so the two measures can be scanned together. The split-panel format emphasizes that employment share and spending share are related but not identical rankings.
Main takeaway from the visual
Government is a large economic presence in many countries on both employment and spending. The twin rankings make it obvious that public-sector scale is substantial even outside the single largest outlier.
Key standout values or extremes
Austria, Sweden, and Denmark sit near the top of the lists, while the United States is called out in bold within the middle of the ranking. The main visual contrast is the spread across countries rather than one single bar dwarfing the rest.
Controls / sequence, when applicable
This is a static chart image with no in-chart controls to operate.
Companion media, when applicable
There is no separate companion audio or video; the chart image is the full visual on this page.