Source page: McKinsey & Company
Commentary
Cautiously optimistic
Consumer | Economy
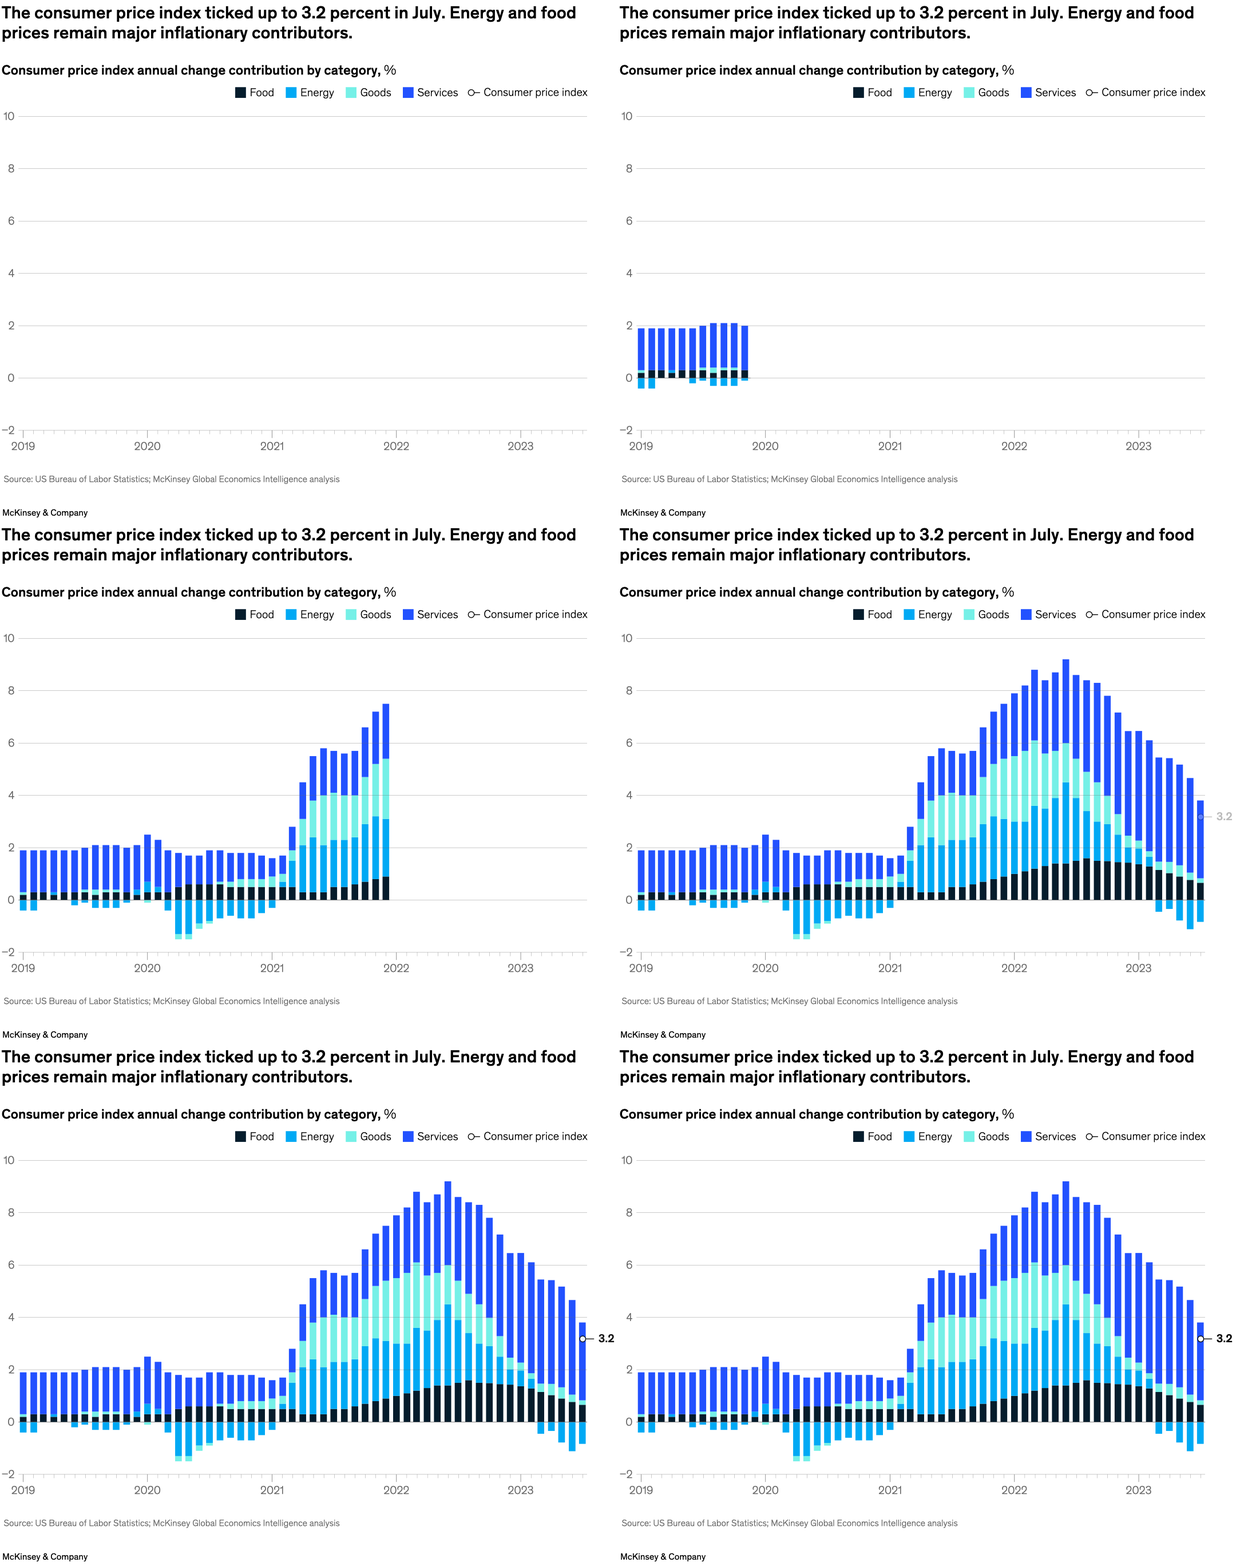
October 2, 2023 – The US economy remains buoyant, despite a slight increase in the consumer price index, from 3.0 percent in June to 3.2 percent in July and even though core inflation nudged only slightly downward from 4.8 to 4.7 percent during that time. Senior partner Sven Smit and colleagues explain that although consumer spending has contracted compared with the previous year, consumer confidence has reached its highest level since July 2021.
To read the article, see “Global Economics Intelligence executive summary, August 2023,” September 20, 2023.
customizer here
Visual form
Decomposed inflation time-series chart. It combines the overall consumer price index line with category contributions.
Layout / body structure
The chart is a single chart running from 2019 through 2023, with the overall consumer price index plotted against category-level contributions from food, energy, goods, and services. Reader follows the line and contribution layers across time rather than reading a ranked list.
What is being compared
It compares overall CPI movement with the contribution of major spending categories, showing which components are pushing inflation up or easing it back down over time.
Measurement system
The vertical scale is annual change contribution in percent, and the horizontal scale tracks time from 2019 to 2023. Color distinguishes food, energy, goods, services, and the overall consumer price index.
Visible structure inside the graphic
The chart uses a time axis, a legend that separates the contributing categories, and a combined overall CPI reference so the reader can connect the headline inflation figure to its components. That makes the chart part trend line and part contribution breakdown.
Main takeaway from the visual
Inflation has eased from its peak, but energy and food still remain important contributors, which is why the page describes the outlook as cautious rather than fully relaxed. The chart is built to show both resilience in the economy and persistence in a few inflation drivers.
Key standout values or extremes
The title highlights the July CPI print at 3.2 percent. The most important visual contrast is between the earlier higher inflation period and the later moderation, with energy and food still standing out as meaningful contributors.
Controls / sequence, when applicable
This is a static chart image with no in-chart controls to operate.
Companion media, when applicable
There is no separate companion audio or video; the chart image is the full visual on this page.