Source page: McKinsey & Company
Commentary
The first cut is the deepest
Sustainability | Climate change
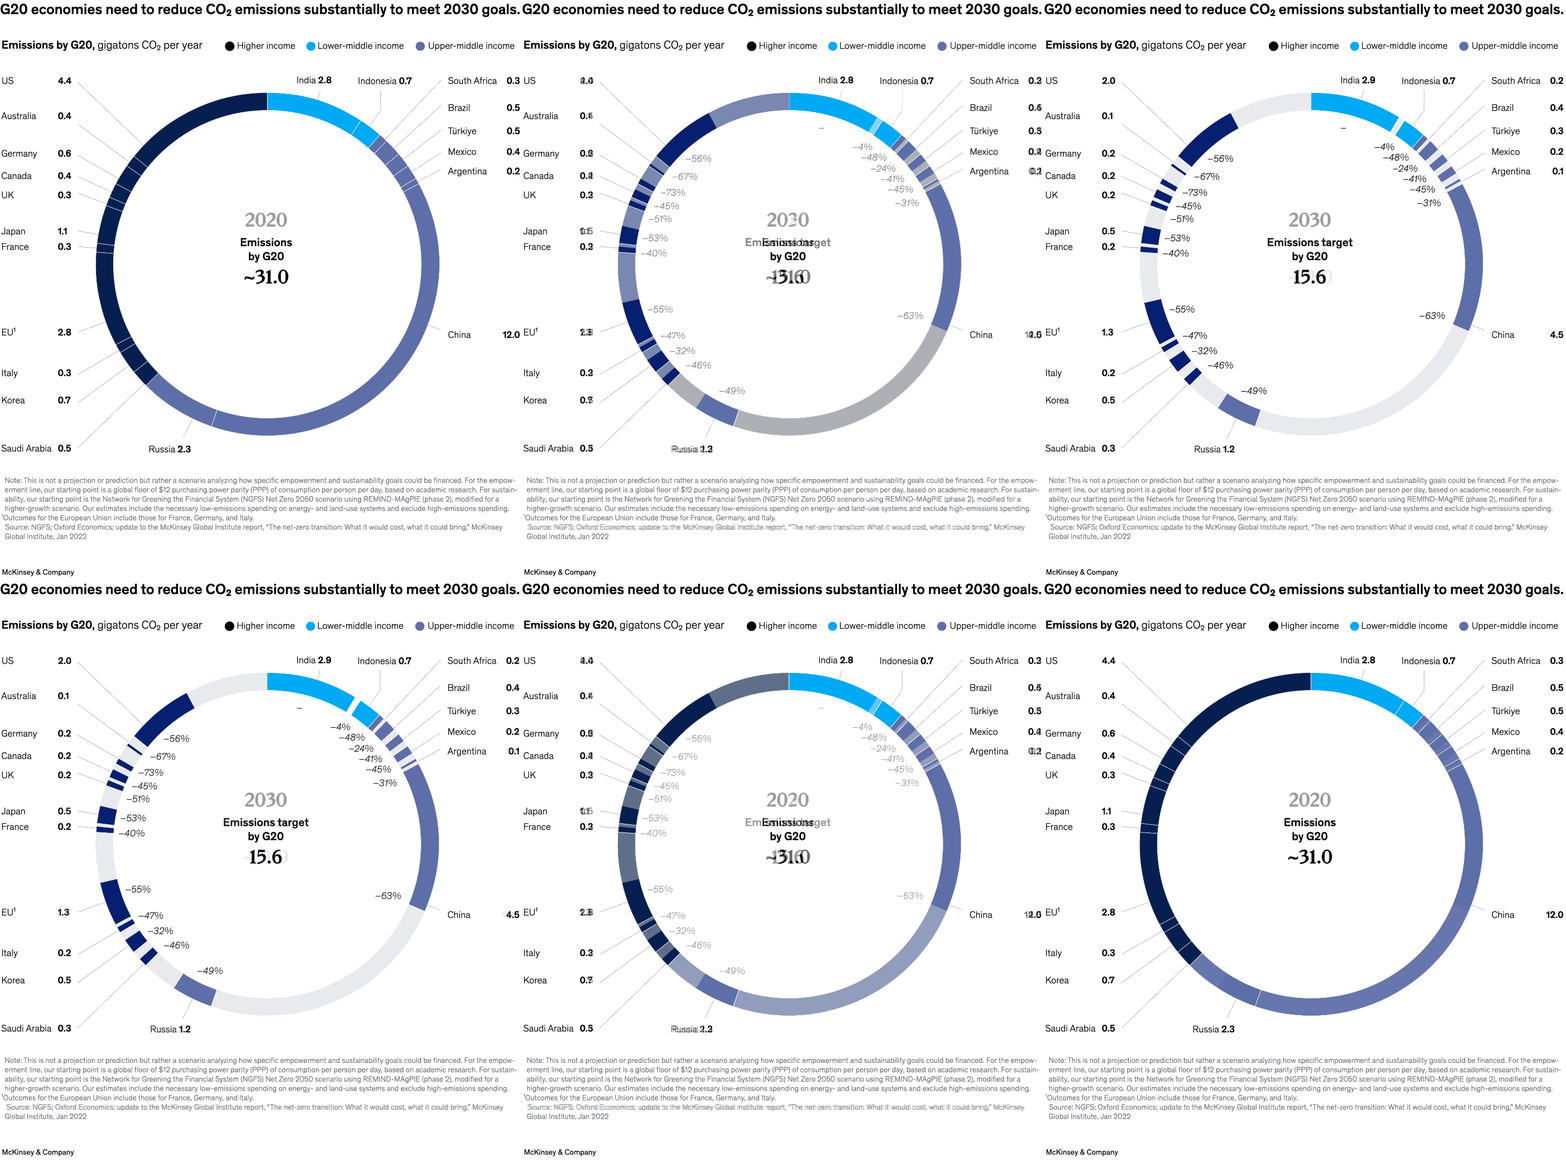
September 22, 2023 – Reaching net-zero greenhouse-gas emissions by 2050 will require G20 economies to accelerate their low-emissions investments this decade, an analysis by senior partners Rajat Dhawan and Amit Khera and colleagues finds. G20 economies emit 31 gigatons of CO2 annually. Staying on track to reach net zero will require the highest-income countries to make the most significant cuts to their emissions.
To read the report, see “Driving sustainable and inclusive growth in G20 economies,” August 25, 2023.
customizer here
Visual form
Circular composition chart. It distributes G20 emissions around a ring rather than along a straight axis.
Layout / body structure
The visual is a single donut-style chart with labels pulled outside the ring and a central total in the middle. Reader moves around the circle country by country while using the legend to separate higher-income, upper-middle-income, and lower-middle-income economies.
What is being compared
It compares annual CO2 emissions across G20 economies in 2020, showing how much each country or grouping contributes to the whole.
Measurement system
The units are gigatons of CO2 per year. Color groups the economies by income band, and the center of the chart gives the approximate total for the full G20.
Visible structure inside the graphic
The chart uses a segmented ring with leader lines to country labels positioned around the outside. That structure makes the largest emitters easy to spot while still keeping all countries tied back to the single total.
Main takeaway from the visual
Meeting the 2030 climate target requires substantial cuts from a small number of very large emitters, because the emissions burden is not evenly spread across the G20. The ring makes that concentration visible immediately.
Key standout values or extremes
China is the largest segment at 12.0 gigatons, while the United States is the next major contributor at 4.4. The chart center also highlights a total of roughly 31.0 gigatons for the G20 in 2020, with India and the EU both at 2.8 and Russia at 2.3.
Controls / sequence, when applicable
This is a static chart image with no in-chart controls to operate.
Companion media, when applicable
There is no separate companion audio or video; the chart image is the full visual on this page.