Source page: McKinsey & Company
Commentary
A net-zero Latin America
Financial services | Sustainability | Latin America
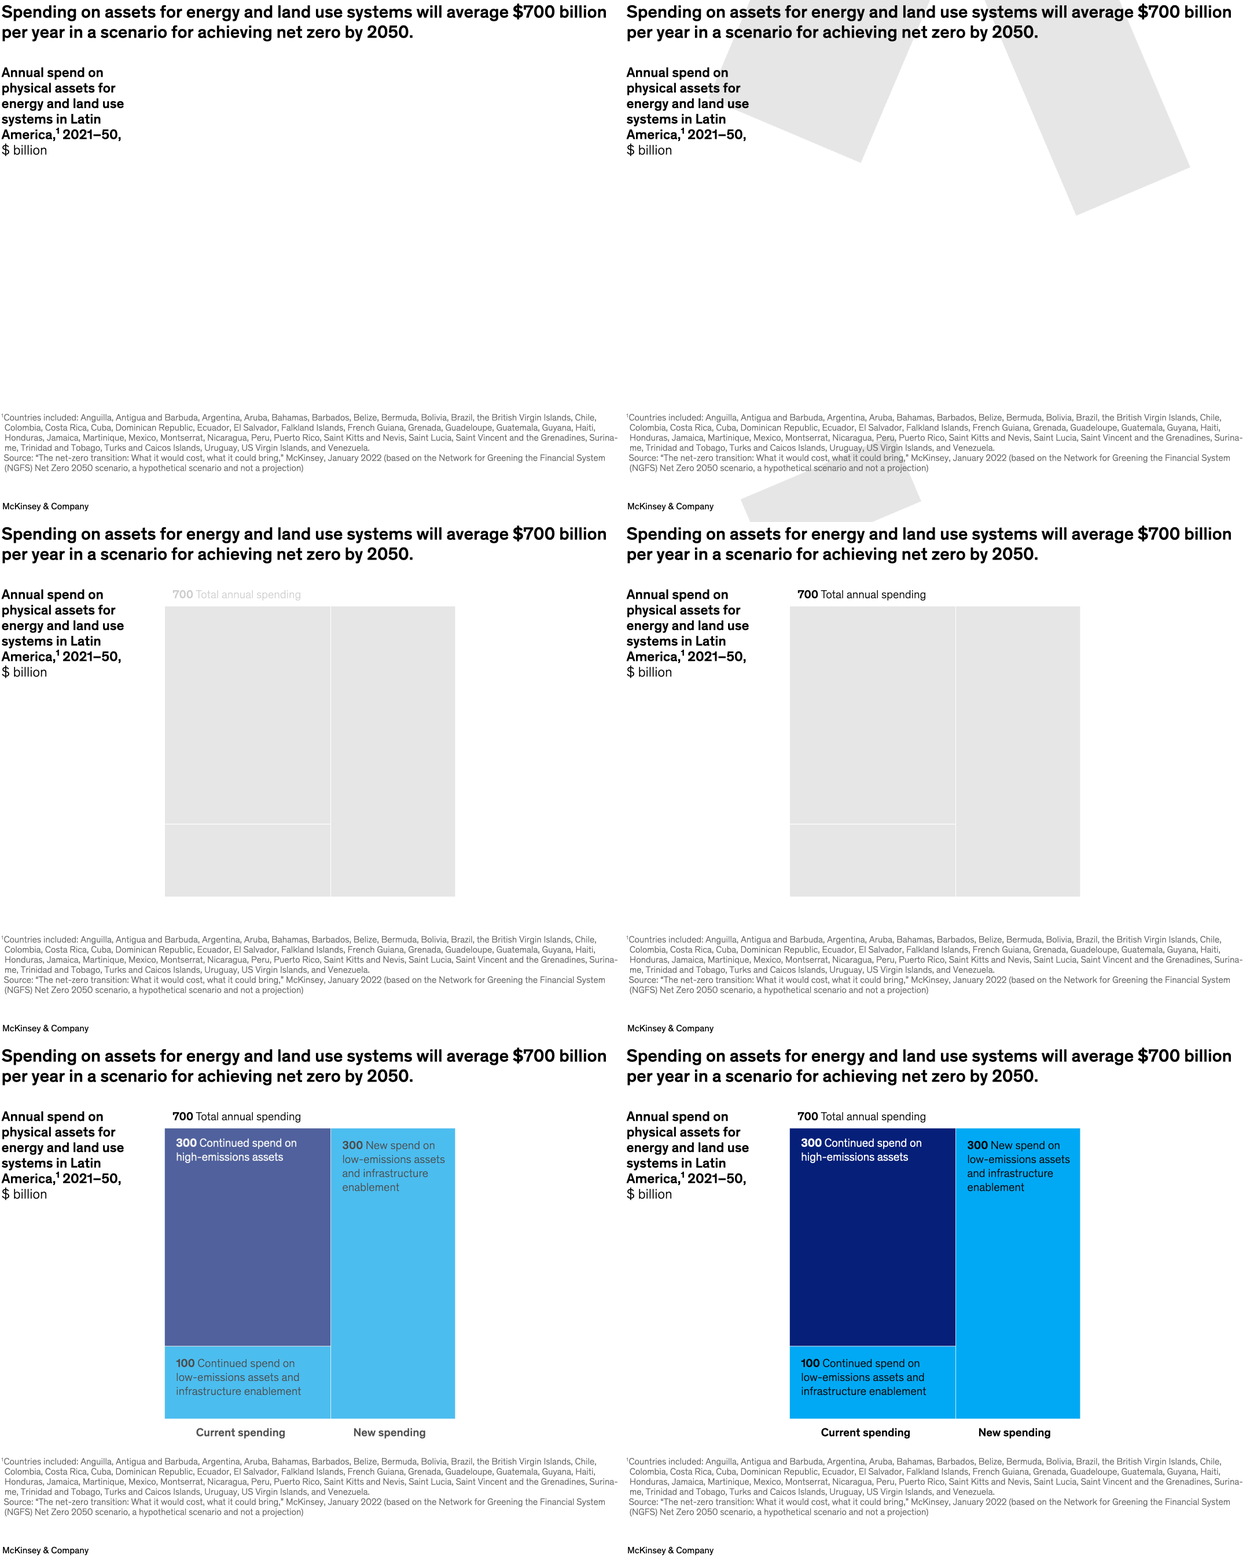
September 13, 2023 – The net-zero transition has picked up steam in Latin America, find senior partners Xavier Costantini and Elias Goraieb and colleagues. Although the region’s financial institutions have generally been slower than those elsewhere to integrate sustainability into strategic agendas, there has been a recent surge in capital flows. According to our research, achieving net zero by 2050 will push Latin America’s total spending on assets related to the physical transition to 9.4 percent of regional GDP, or about $20 trillion, with spending on physical assets rising by about $700 billion a year.
To read the report, see “Are Latin American financial institutions ready for sustainability?,” August 9, 2023.
customizer here
Visual form
Long-horizon spending profile chart. It frames a transition pathway in annual capital-spending terms.
Layout / body structure
The chart is presented as a single spending view focused on annual physical-asset investment for energy and land-use systems in Latin America from 2021 to 2050. The reading order is left to right across the long horizon.
What is being compared
It compares the scale of annual spending required for Latin America’s net-zero transition, focusing on physical assets tied to energy and land-use systems.
Measurement system
The units are billions of dollars per year. The chart uses a long time horizon so the reader can connect yearly spending to the broader 2050 transition pathway.
Visible structure inside the graphic
The visual is built around one long-run spending trajectory rather than multiple categories competing for attention. That keeps the focus on the sustained annual commitment implied by the net-zero scenario.
Main takeaway from the visual
Achieving net zero in Latin America requires a very large, sustained capital build-out, not a small one-time push. The chart is designed to make the annual spending burden feel structural and persistent.
Key standout values or extremes
The title highlights the central figure: annual spending on energy and land-use assets averaging 700 billion dollars per year. The supporting text also links that requirement to roughly 20 trillion dollars in total transition spending and about 9.4 percent of regional GDP.
Controls / sequence, when applicable
This is a static chart image with no in-chart controls to operate.
Companion media, when applicable
There is no separate companion audio or video; the chart image is the full visual on this page.