Source page: McKinsey & Company
Commentary
A wider academic gap
Education | Diversity & Inclusion
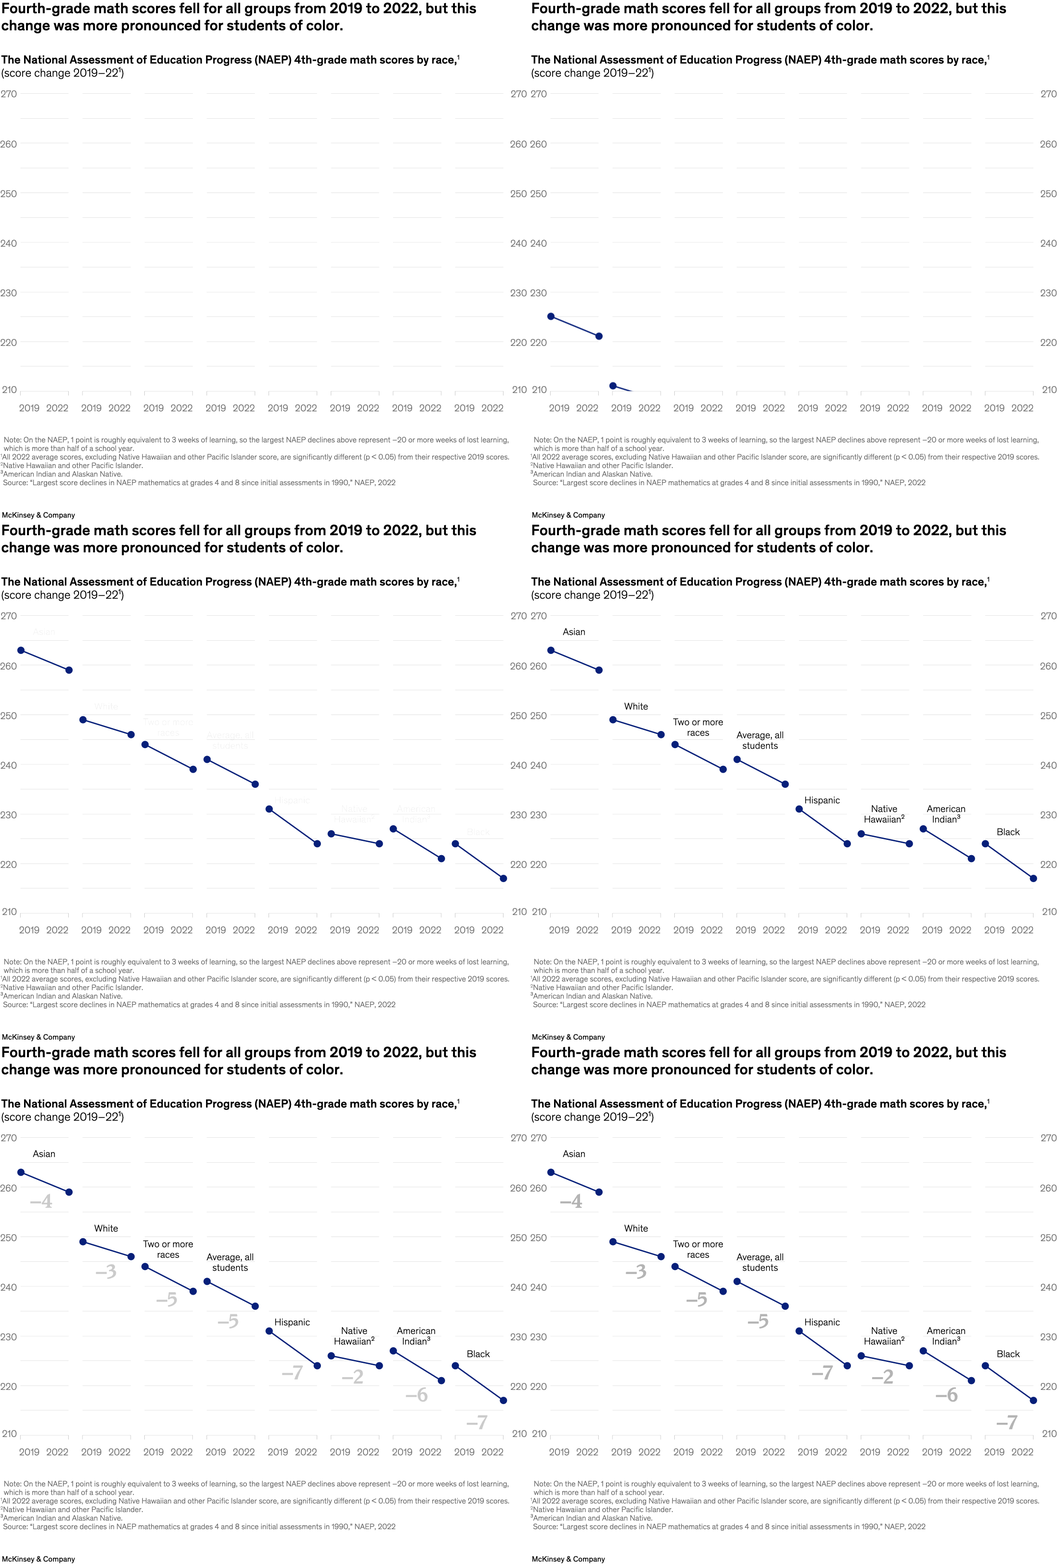
September 8, 2023 – Through the 1970s and ’80s, racial inequities in academic outcomes were diminishing, but meaningful progress for students of color has stalled. The COVID-19 pandemic wiped out two decades’ worth of math and reading progress for US fourth and eighth graders, exacerbating existing disparities. Partners Jake Bryant and Duwain Pinder and colleagues show that Black fourth-graders recorded a seven-point decline in math test scores, compared with a three-point drop for White students.
To read the article, see “Advancing racial equality in US pre-K-12 education,” July 21, 2023.
customizer here
Visual form
Multi-group change chart on a shared score scale. It compares fourth-grade math outcomes across racial groups between two years.
Layout / body structure
The chart repeats the 2019 and 2022 comparison for each racial group across a long horizontal layout. The reading order is group by group, with the shared score grid making the declines comparable across the full span.
What is being compared
It compares NAEP fourth-grade math scores by race, showing how scores changed from 2019 to 2022 for White students and for students of color across multiple groups.
Measurement system
The vertical score scale runs roughly from 210 to 270, and each group is anchored by a 2019 point and a 2022 point. The chart measures score change, not percent change or ranking position.
Visible structure inside the graphic
The chart uses repeated two-point comparisons across a shared score grid, which makes the differences in drop size easy to scan across groups. The repeated structure is what turns the chart into an equity-gap visual instead of a simple overall average.
Main takeaway from the visual
Scores fell for everyone, but the losses were steeper for students of color, which widened already-existing disparities. The visual is built to show unequal decline rather than a uniform national drop.
Key standout values or extremes
The supporting text flags a seven-point decline for Black fourth-graders versus a three-point decline for White students, and the score notes explain that one NAEP point is roughly equivalent to three weeks of learning. That makes the larger drops visually and substantively significant.
Controls / sequence, when applicable
This is a static chart image with no in-chart controls to operate.
Companion media, when applicable
There is no separate companion audio or video; the chart image is the full visual on this page.