Source page: McKinsey & Company
Commentary
Climate-friendly farming
Agriculture | Sustainability
July 20, 2023 – Agriculture is a key consideration in global sustainability efforts: agricultural land accounts for half of all habitable land worldwide and 70 percent of freshwater withdrawals. Reaching a 1.5°C pathway will require changes that extend well beyond the farm, according to partner Vasanth Ganesan and coauthors. Sustainable food production, reducing food waste, and changing dietary practices may help achieve decarbonization goals while also meeting global food needs.
To read the report, see “The agricultural transition: Building a sustainable future,” June 27, 2023.
customizer here
Visual form
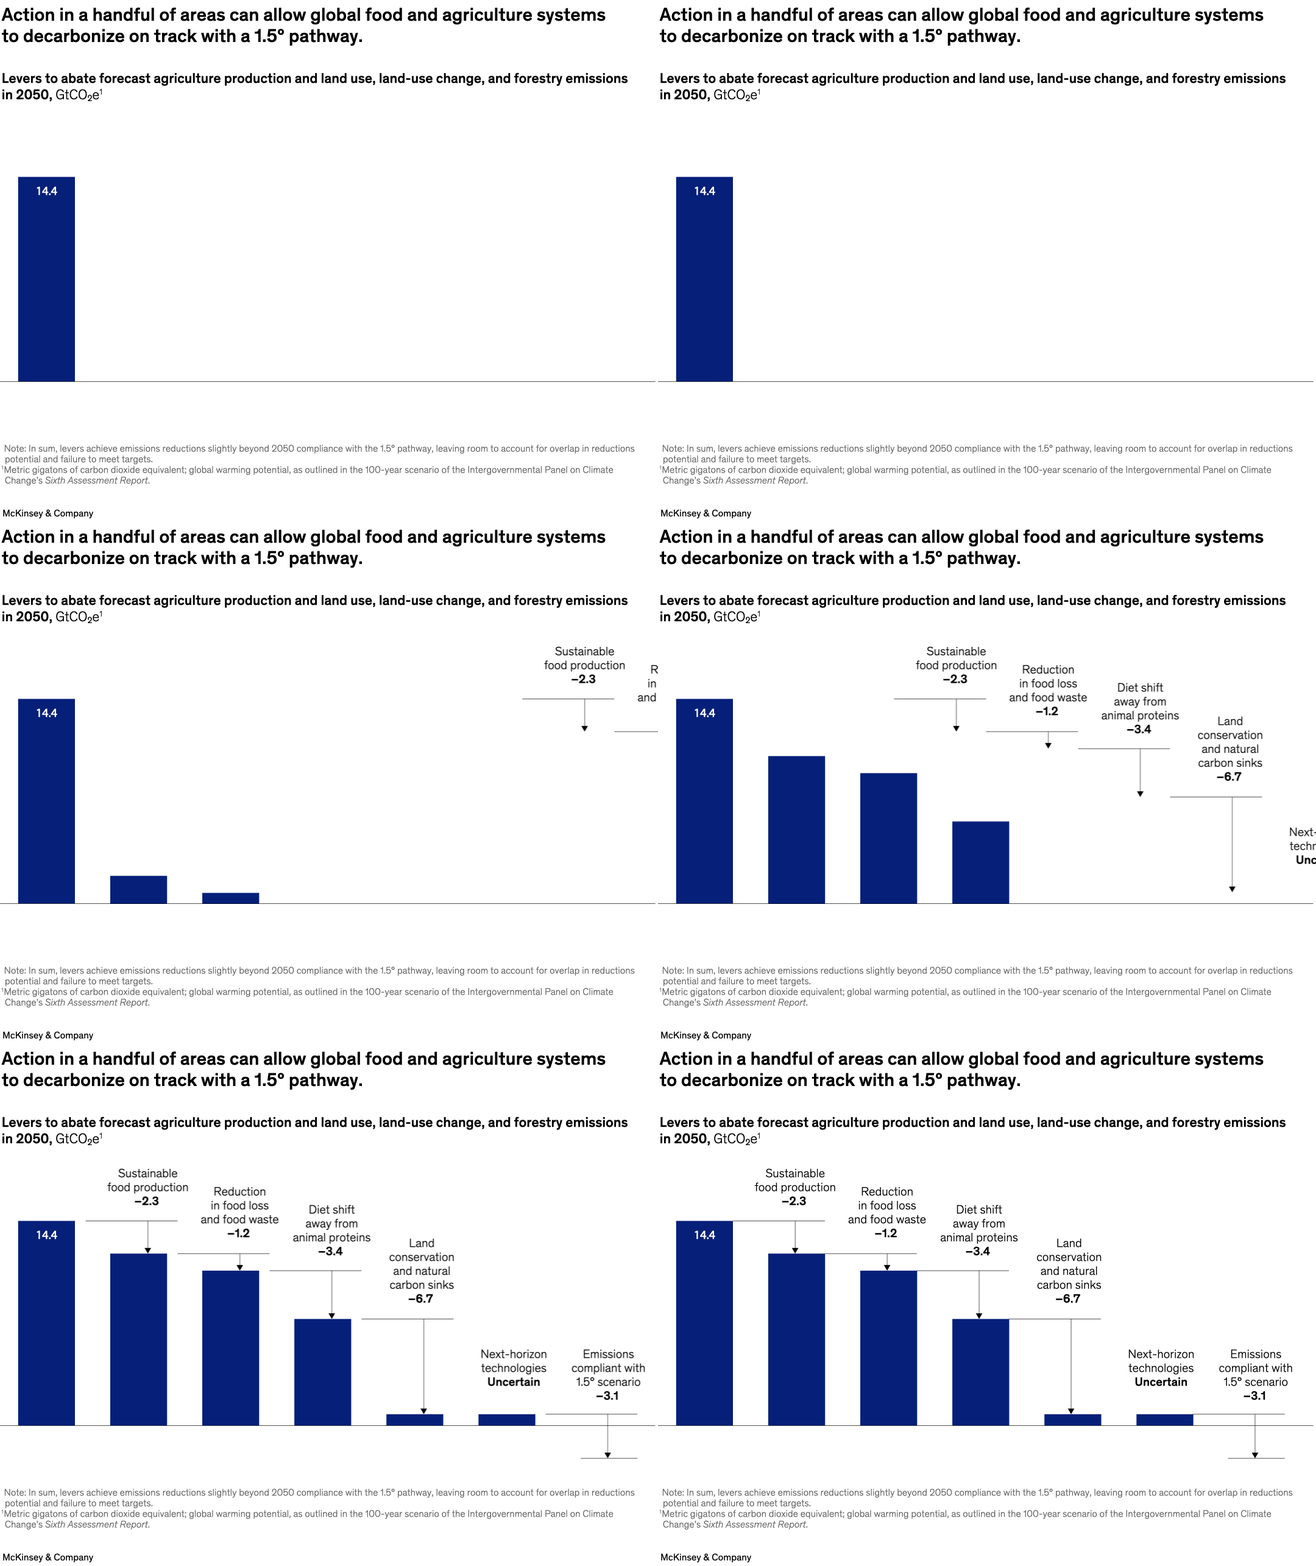
Waterfall chart.
Layout / body structure
A single bridge-style chart reads left to right, with downward steps for each abatement lever and annotations above the drops.
What is being compared
It compares the emissions-reduction effect of several food-and-agriculture levers, including sustainable food production, food-loss and food-waste reduction, and dietary shift away from animal proteins.
Measurement system
The measure is gigatons of carbon-dioxide equivalent in 2050, with each step labeled by the size of its reduction contribution.
Visible structure inside the graphic
The chart uses a starting level, successive downward bars, and labeled intervention steps so the reader can see how separate levers combine toward a lower-emissions outcome.
Main takeaway from the visual
The bridge makes the point that decarbonization depends on a small set of sizable levers working together rather than on one marginal improvement alone.
Key standout values or extremes
The visible callouts include reductions of -2.3, -1.2, and -3.4 gigatons for major levers, showing that dietary change and production shifts carry some of the largest blocks in the sequence.
Controls / sequence, when applicable
This is a static chart image with no in-chart controls to operate.
Companion media, when applicable
There is no separate companion audio or video; the chart image is the full visual on this page.