Source page: McKinsey & Company
Commentary
Productivity lags behind 'paper wealth'
Economy
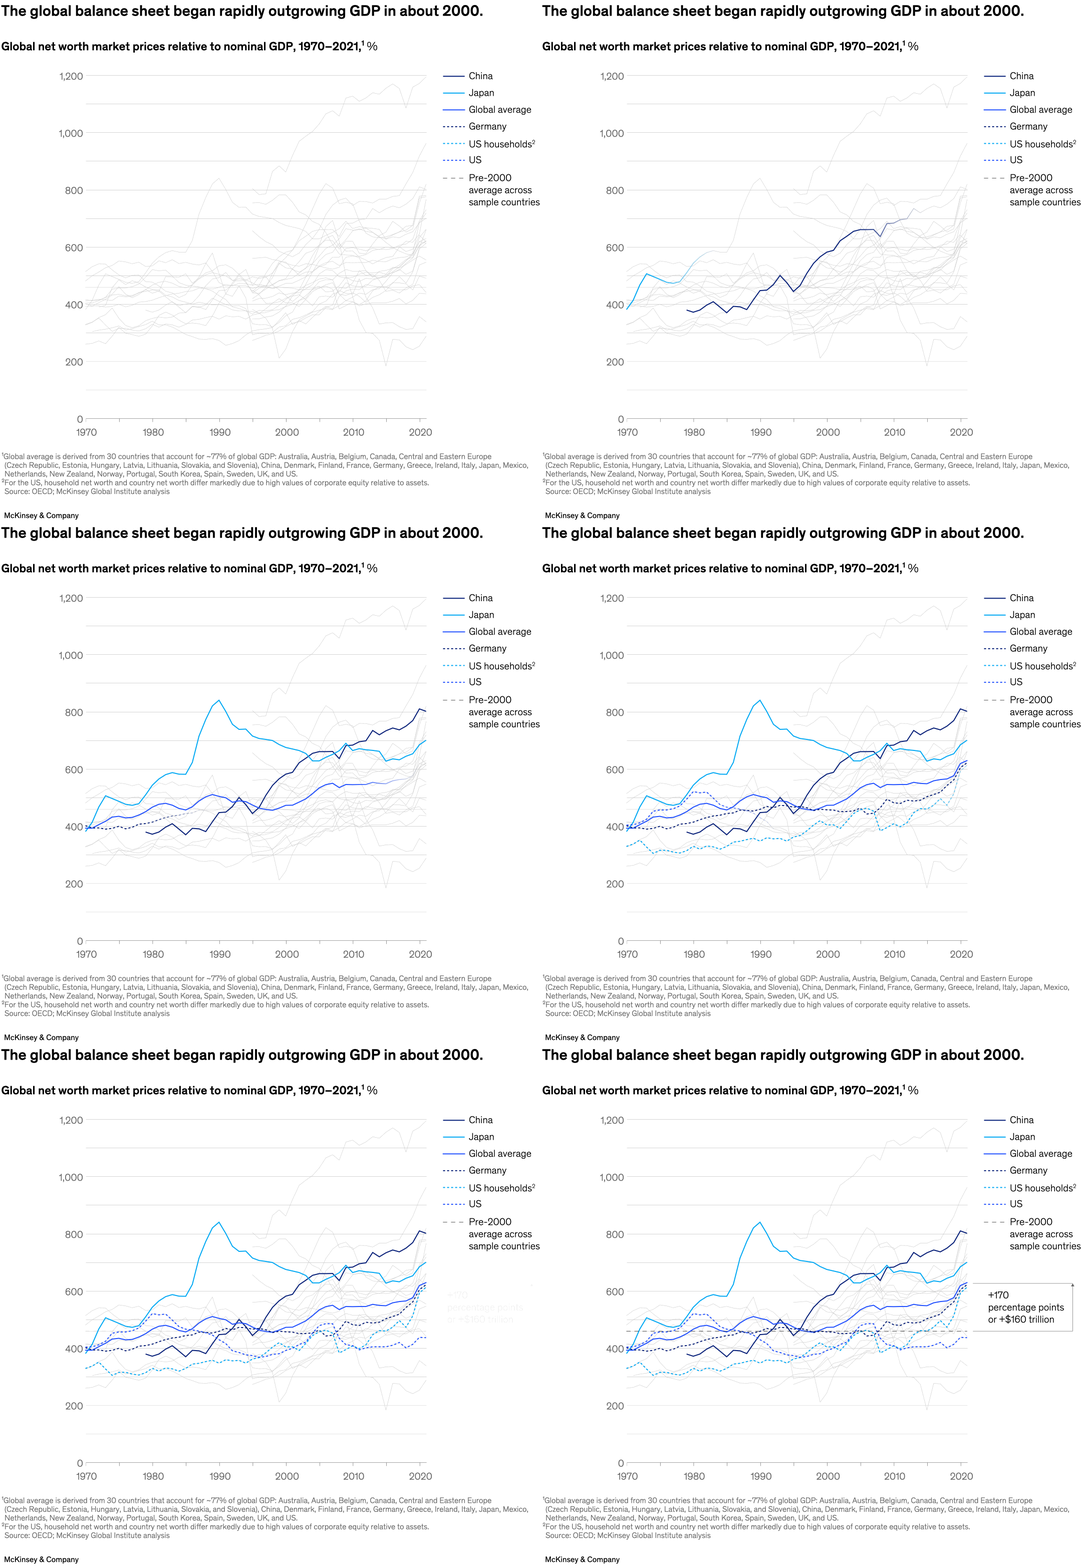
June 22, 2023 – Global economic growth has been sluggish over the past two decades, even as asset price inflation created “paper wealth” of $160 trillion, according to a recent report by the McKinsey Global Institute (MGI). Global net worth for the most part grew with GDP growth until 2000, MGI chair and chair of insights and ecosystems Sven Smit and coauthors note. However, around the turn of the millennium, asset values, net worth, and debt started growing faster than GDP, as G-7 countries saw productivity growth drop from 1.8 percent annually for 1980–2000 to 0.8 percent for 2000–18.
To read the report, see “The future of wealth and growth hangs in the balance,” May 24, 2023.
customizer here
Visual form
Multi-line time-series chart.
Layout / body structure
One large line chart runs from 1970 to 2021, with many country lines in the background and selected named series called out in the legend on the right.
What is being compared
It compares global net worth at market prices relative to nominal GDP across multiple countries and reference series, including China, Japan, the global average, Germany, the United States, and US households.
Measurement system
The vertical scale is percentage, rising to about 1,200, and the horizontal scale is calendar year, with a dashed pre-2000 average reference also identified in the legend.
Visible structure inside the graphic
The visual layers many thin country lines behind the highlighted reference series, uses horizontal gridlines for scale, and positions the legend outside the plotting area so the named lines can be matched to the trajectories.
Main takeaway from the visual
The lines cluster much closer together before 2000 and then fan out upward after that point, which is the visual evidence behind the claim that balance-sheet growth began to outpace GDP more aggressively around the turn of the millennium.
Key standout values or extremes
China is the highest visible trajectory by the end of the series, rising toward the 1,200 percent level, while several other lines end materially lower, which makes the post-2000 spread much wider than the earlier clustering.
Controls / sequence, when applicable
This is a static chart image with no in-chart controls to operate.
Companion media, when applicable
There is no separate companion audio or video; the chart image is the full visual on this page.