Source page: McKinsey & Company
Commentary
One firm, exponential results
Strategy | Organization
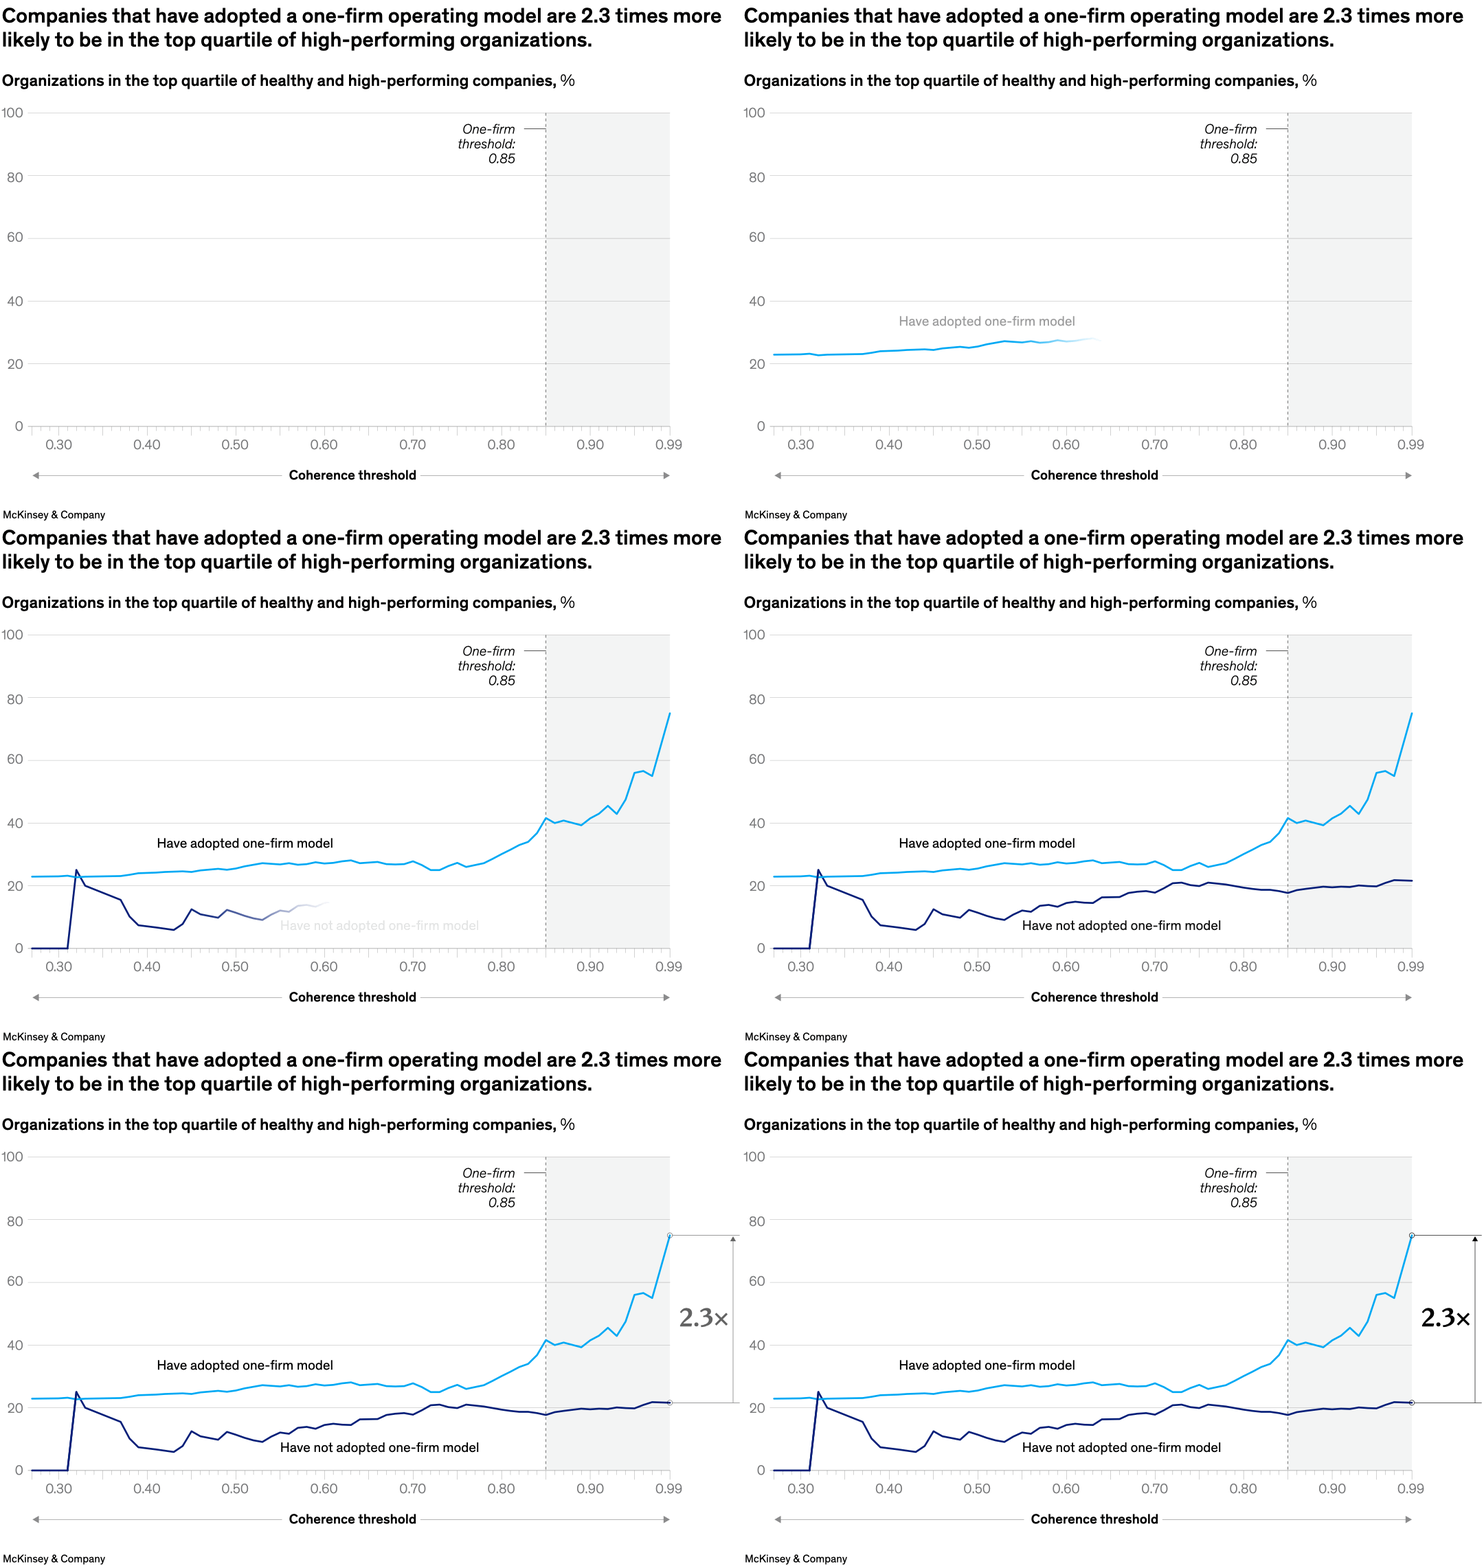
June 15, 2023 – There’s value in operating as “one firm,” according to senior partner Scott Keller and coauthors. Companies that have adopted a one-firm model—which might include coordination of decision making, cooperative teamwork, or an emphasis on “we, us, our”—are 2.3 times more likely to be in the top quartile of high-performing organizations.
To read the article, see “Capturing the value of ‘one firm’,” May 9, 2023.
customizer here
Visual form
Threshold line chart.
Layout / body structure
The chart reads left to right along a coherence-threshold axis, with the performance line plotted across the lower part of the chart and a dashed vertical threshold line marking the one-firm cutoff.
What is being compared
It compares the share of organizations in the top quartile of healthy and high-performing companies against different coherence-threshold levels for one-firm operating behavior.
Measurement system
The vertical axis is percent of organizations in the top quartile, and the horizontal axis is coherence threshold, with the one-firm threshold specifically called out at 0.85.
Visible structure inside the graphic
A single sloping line shows performance as the threshold changes, the dashed line marks the one-firm threshold, and a shaded region on the right visually separates the area beyond that cutoff.
Main takeaway from the visual
The chart is designed to show that higher coherence is associated with better organizational performance and that the one-firm threshold sits in the upper end of that relationship rather than in the middle of it.
Key standout values or extremes
The page headline ties the relationship to a 2.3-times advantage for companies that adopt a one-firm operating model, and the threshold annotation marks the key cutoff at 0.85.
Controls / sequence, when applicable
This is a static chart image with no in-chart controls to operate.
Companion media, when applicable
There is no separate companion audio or video; the chart image is the full visual on this page.