Source page: McKinsey & Company
Commentary
When modular construction doesn’t stack up
Construction | Operations
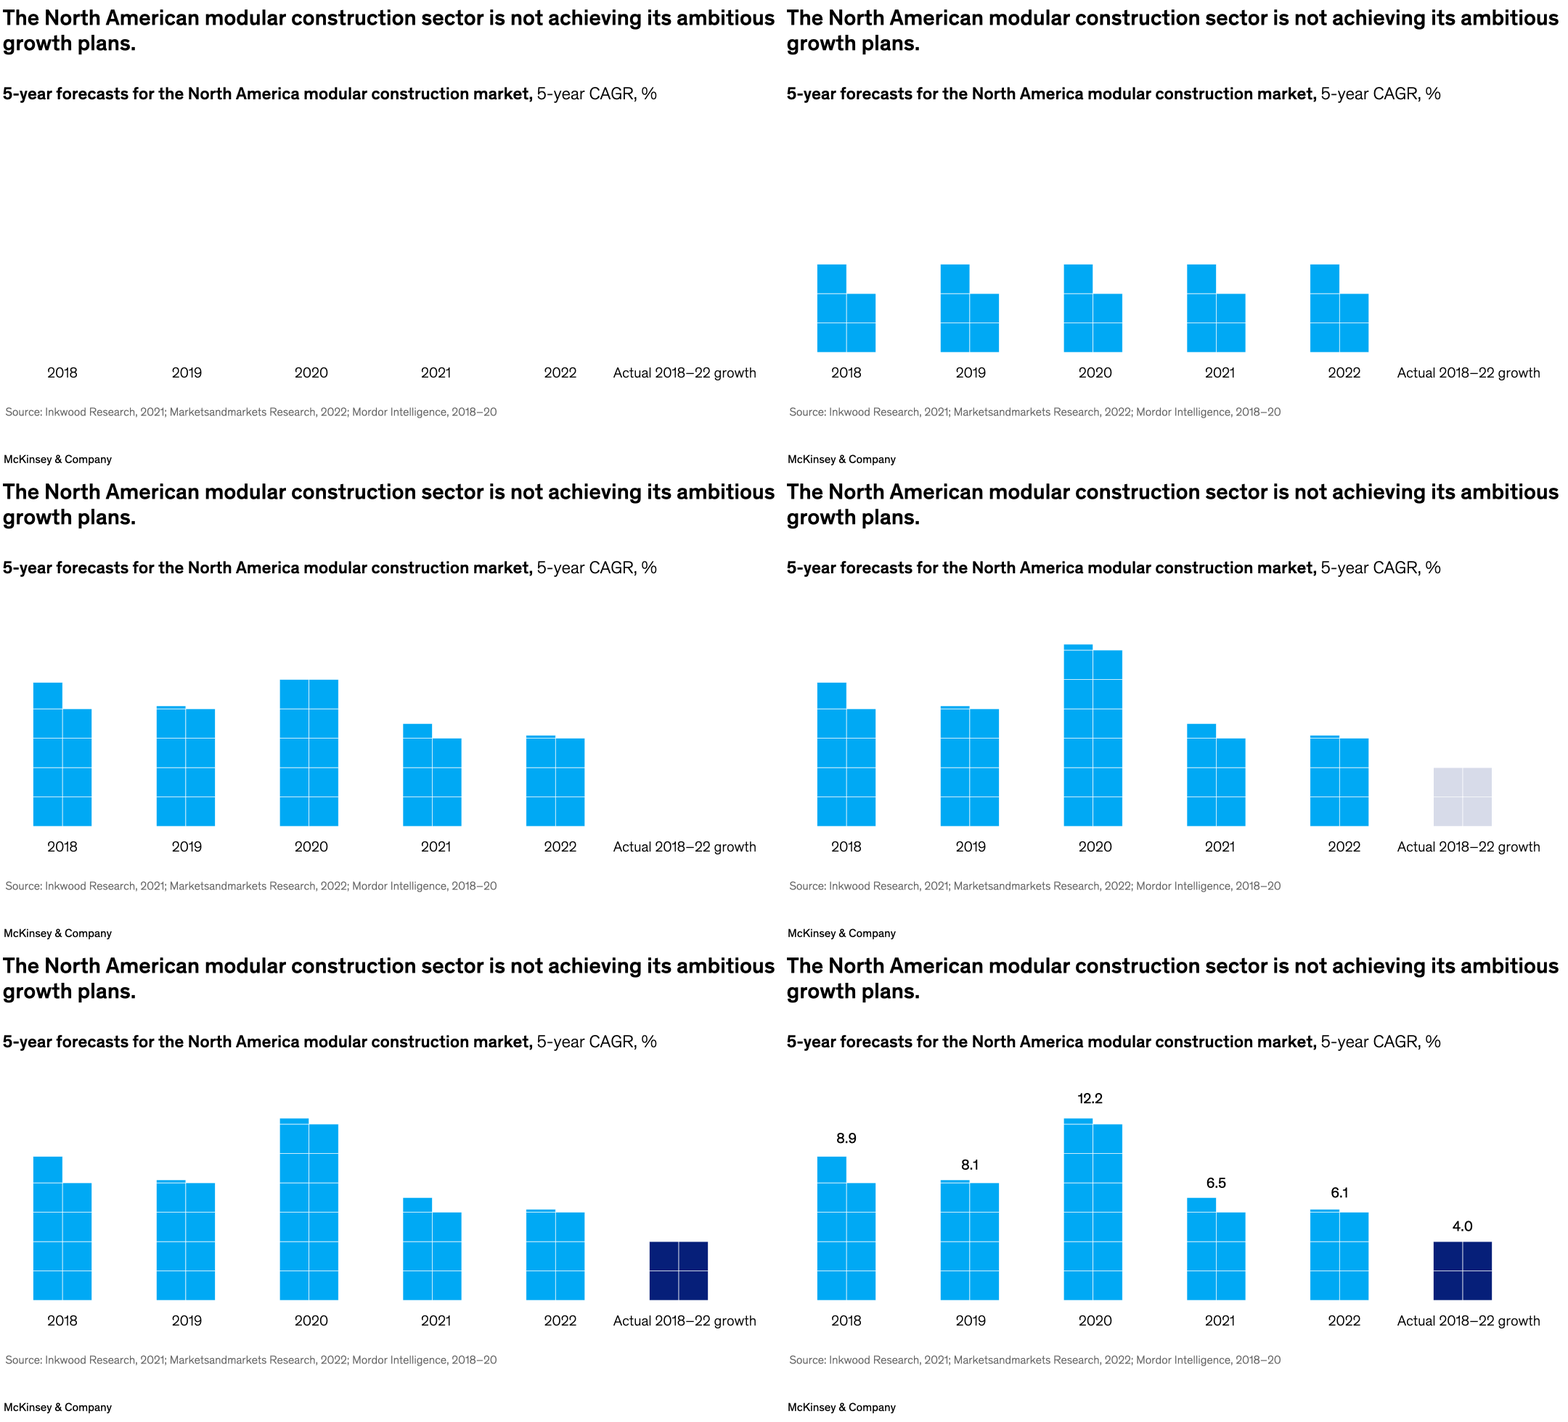
June 14, 2023 – The US housing shortage—particularly of affordable housing—could be eased by modular construction, but the technique hasn’t gained wide acceptance in North America compared with other nations, according to senior partners Jose Luis Blanco and Rob Palter and coauthors. North American modular companies set ambitious plans, but demonstrated only modest growth, at about 4 percent, from 2018–22.
To read the article, see “Making modular construction fit,” May 10, 2023.
customizer here
Visual form
Year-by-year forecast comparison chart.
Layout / body structure
The chart lays out forecast markers for 2018 through 2022 in a left-to-right sequence and then sets those against a final label for actual 2018 to 2022 growth.
What is being compared
It compares five-year CAGR forecasts for the North American modular construction market with the market’s actual realized growth over the same period.
Measurement system
The measure is five-year CAGR in percent, and each year block is presented as its own forecast point or range before the actual-growth comparison at the far right.
Visible structure inside the graphic
The sequence is built from repeated blue forecast blocks for each year, a common baseline, and a final actual-growth label that makes the comparison between plans and outcomes explicit.
Main takeaway from the visual
The repeated forecast blocks convey persistent optimism, but the chart’s setup against actual realized growth shows that the market did not come close to meeting those ambitions.
Key standout values or extremes
The source text anchors the shortfall with actual growth of only about 4 percent from 2018 to 2022, which is much weaker than the stacked sequence of ambitious forecast expectations represented earlier in the chart.
Controls / sequence, when applicable
This is a static chart image with no in-chart controls to operate.
Companion media, when applicable
There is no separate companion audio or video; the chart image is the full visual on this page.