Source page: McKinsey & Company
Commentary
Quality over conscience?
Sustainability | Consumer
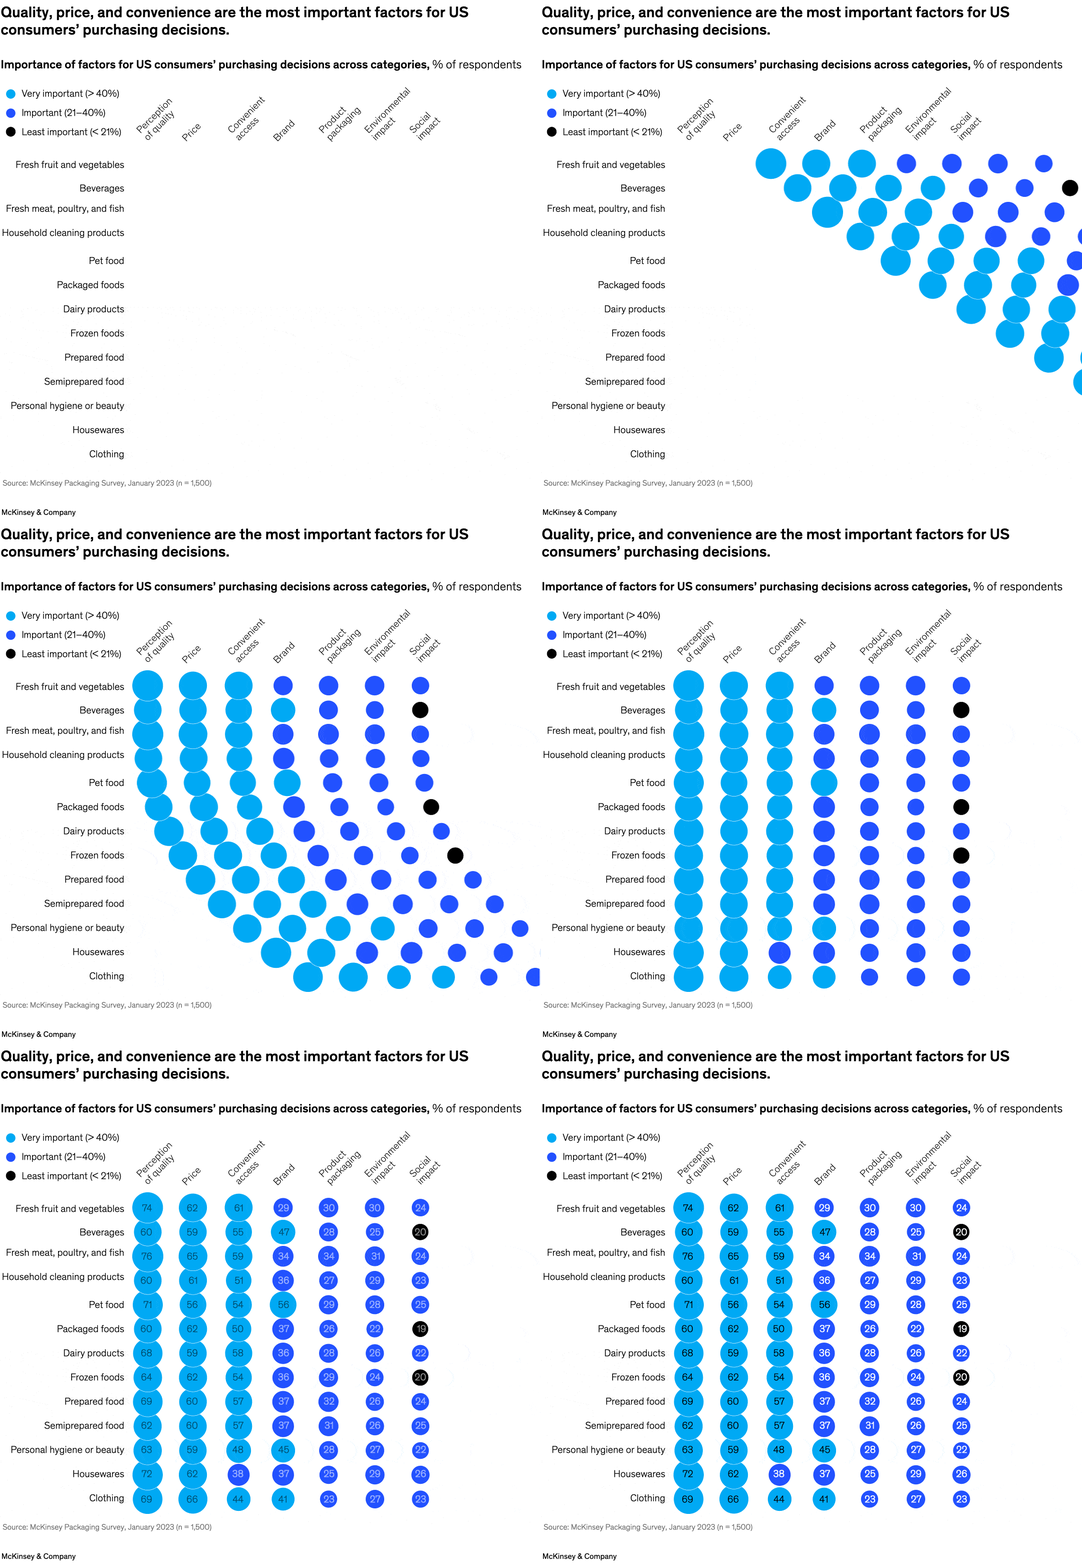
June 6, 2023 – US consumers say product packaging and environmental impact are less important than quality, price, and convenience when considering a purchase, according to a survey by senior partner David Feber and colleagues. However, a deeper dive into the data reveals some difference in attitudes based on demographics. Younger and urban consumers tend to prioritize environmental considerations, compared with baby boomers and consumers living in rural areas, for example.
To read the article, see “Sustainability in packaging: US survey insights,” April 26, 2023.
customizer here
Visual form
Dot-matrix comparison chart.
Layout / body structure
A single matrix runs left to right across purchasing factors and top to bottom across product categories, with slanted factor labels above the grid and a legend parked in the upper-left corner.
What is being compared
It compares how consumers rank seven decision factors across food, household, and personal-product categories, including quality, price, convenient access, brand, product packaging, environmental impact, and social impact.
Measurement system
The measure is respondent importance bands rather than a numeric axis, with the legend grouping each dot into very important, important, or least important by percentage of respondents.
Visible structure inside the graphic
Each category row is built from colored circles that step diagonally across the page, so the reader scans horizontally within a category and then vertically down a factor column to see where the blue importance dots cluster.
Main takeaway from the visual
The strongest concentration of blue dots sits under quality, price, and convenient access, while packaging, environmental impact, and especially social impact move toward the less-important end of the matrix.
Key standout values or extremes
The legend sets the thresholds at more than 40 percent for very important, 21 to 40 percent for important, and less than 21 percent for least important, and the only black least-important marker in the visible frame sits on the social-impact side of the chart.
Controls / sequence, when applicable
This is a static chart image with no in-chart controls to operate.
Companion media, when applicable
There is no separate companion audio or video; the chart image is the full visual on this page.