Source page: McKinsey & Company
Commentary
Gauging employees' mental health
Healthcare | Mental health | Workplace
May 24, 2023 – Four of five HR leaders surveyed by the McKinsey Global Institute say mental health and well-being are top priorities for their organizations. Senior partners Dana Maor, Michael Park, Patrick Simon, and colleagues explain that employers can reduce attrition by devising specific interventions, such as policies to reduce burnout, to address employees’ shifting mental health and well-being concerns over time.
To read the report, see “The State of Organizations 2023: Ten shifts transforming organizations,” April 26, 2023.
customizer here
Visual form
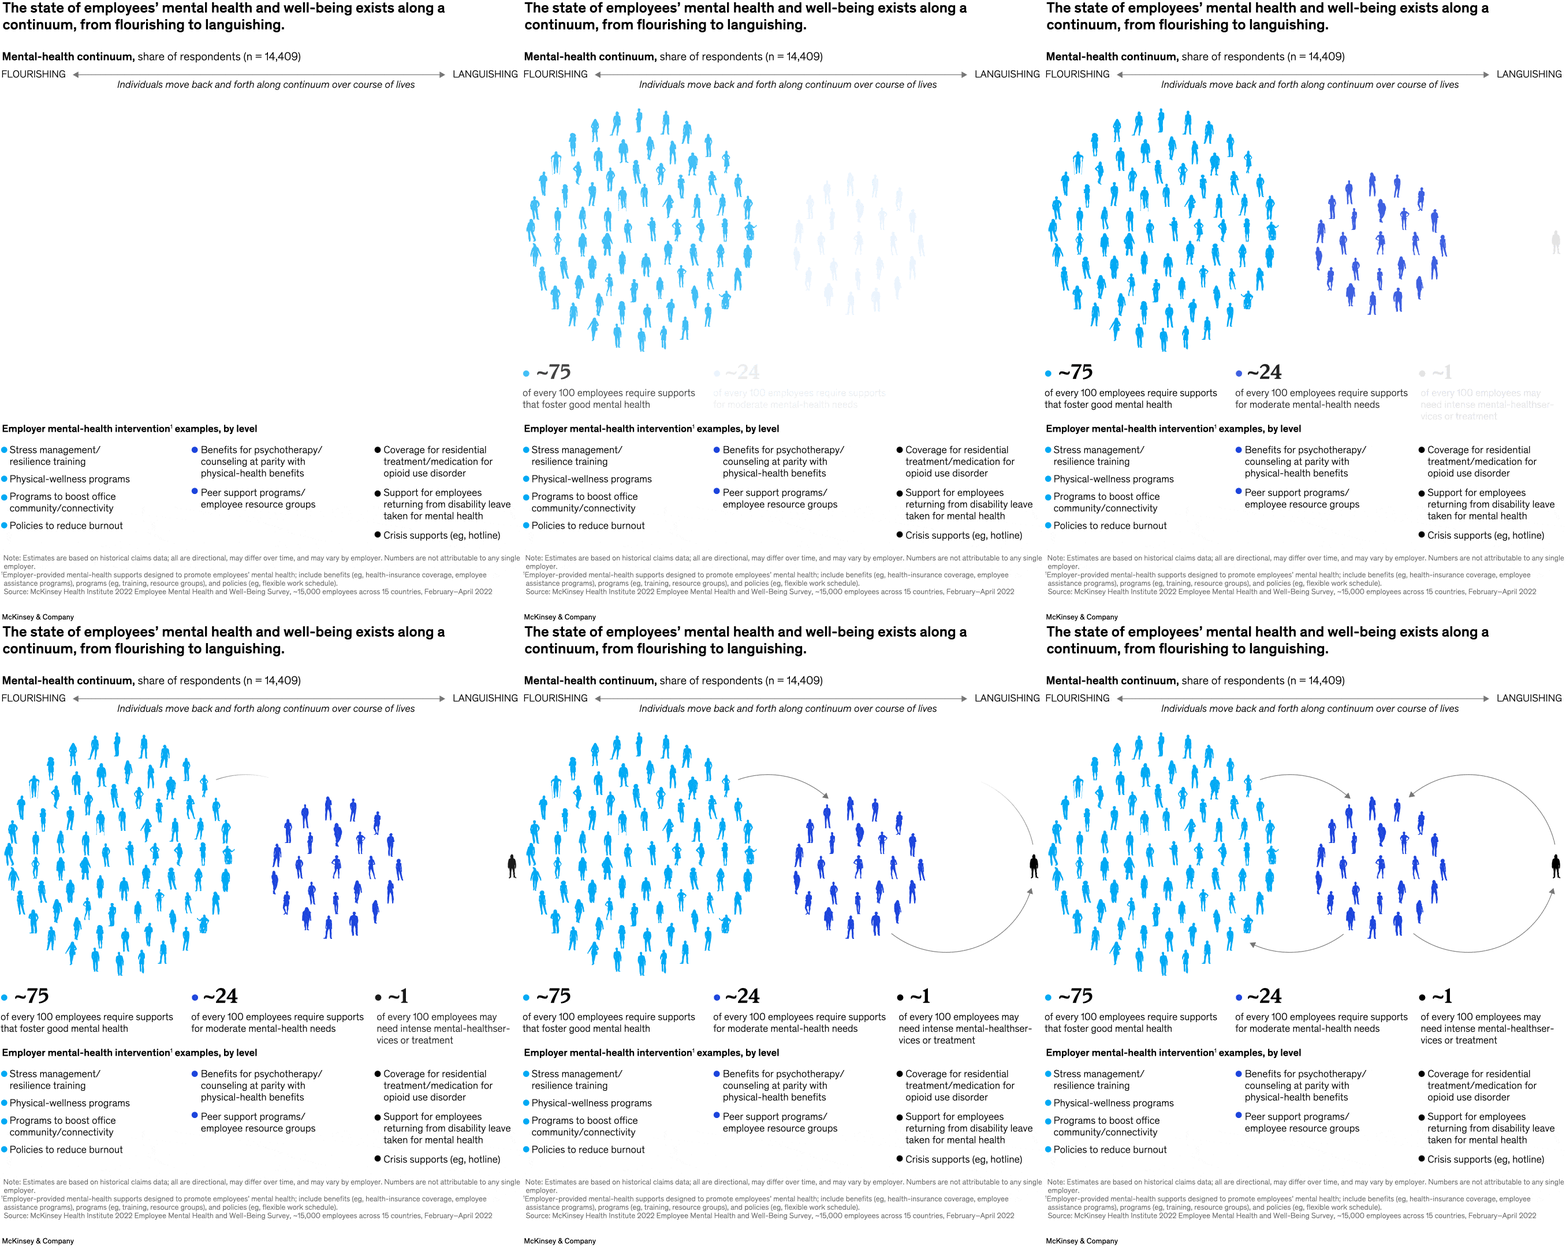
Continuum infographic built from person icons and intervention bands.
Layout / body structure
A single visual runs from left to right across a flourishing-to-languishing continuum, then drops into a lower intervention section that lists supports by level of need.
What is being compared
It compares different levels of employee mental-health need, from the large group needing everyday supports through the smaller groups needing moderate or intensive help.
Measurement system
The graphic uses people out of every 100 employees rather than a time axis or dollar scale, so the reader tracks population shares and support tiers instead of trend lines.
Visible structure inside the graphic
A directional continuum sits across the top, clusters of person icons occupy different points on that continuum, and the lower half breaks out the kinds of supports attached to each level, from resilience and wellness programs to counseling, parity, return-from-disability help, and crisis support.
Main takeaway from the visual
Most employees sit on the healthier end of the continuum and benefit from broad supports, while a smaller but still material share needs targeted or intensive intervention, so the chart makes the support model look graduated rather than one-size-fits-all.
Key standout values or extremes
The chart calls out about 75 of every 100 employees as needing supports that foster good mental health and about 24 of every 100 as needing supports for moderate mental-health needs, leaving only the smallest tail at the highest-need end of the continuum.
Controls / sequence, when applicable
This is a static chart image with no in-chart controls to operate.
Companion media, when applicable
There is no separate companion audio or video; the chart image is the full visual on this page.