Source page: McKinsey & Company
Commentary
Under pressure
Supply Chain Management | Construction
May 11, 2023 – The effects of inflation on commodity prices and supply chains put added pressure on the construction industry’s procurement strategies, partner Erik Sjödin and coauthors explain. Due in part to external challenges such as limited control over project specifications, construction falls behind other industries—logistics and technology, for example—in procurement best practices.
To read the article, see “The strategic era of procurement in construction,” April 19, 2023.
customizer here
Visual form
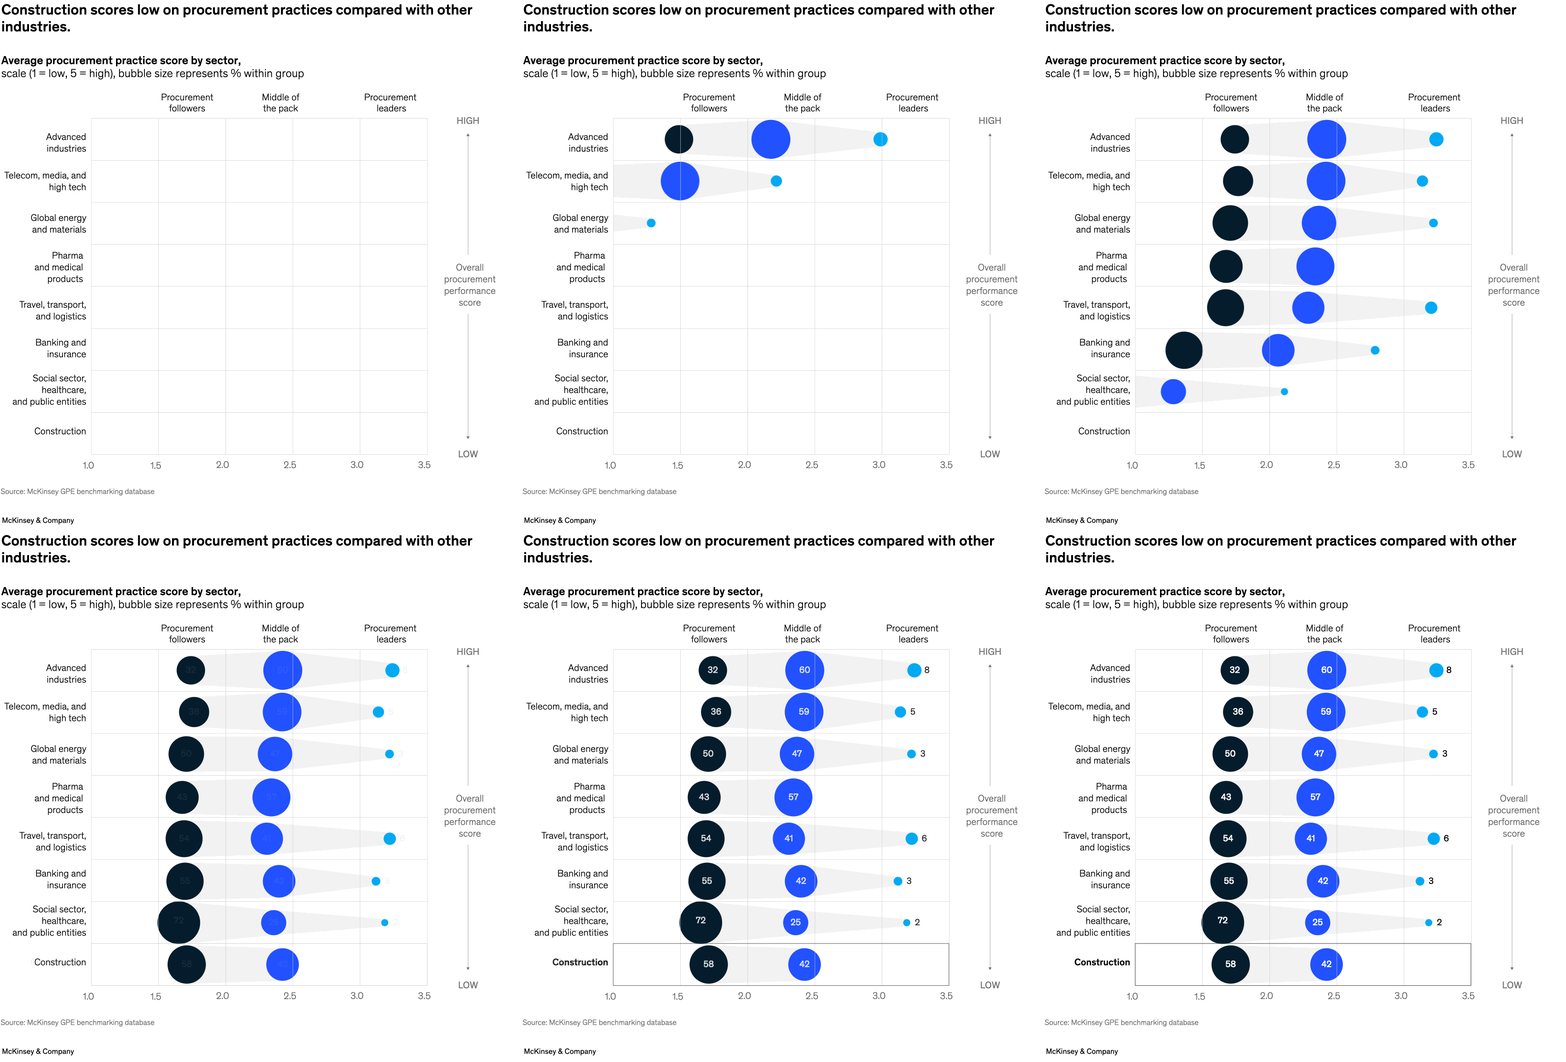
Sector-by-sector bubble chart.
Layout / body structure
The chart is laid out as a grid with industry sectors listed top to bottom, procurement-performance score on the horizontal axis, and three horizontal zones labeled procurement followers, middle of the pack, and procurement leaders.
What is being compared
It compares how each sector is distributed across procurement maturity levels and how strong each sector’s overall procurement-practice score is relative to the others.
Measurement system
The horizontal scale runs from 1 low to 5 high procurement-practice score, while bubble size represents the share of companies within each maturity group for that sector.
Visible structure inside the graphic
Each sector row contains up to three circles: a dark bubble for followers, a blue bubble for the middle of the pack, and a small bright bubble for leaders, with the bubble labels giving the percentage inside each group and the x-position showing the overall sector score.
Main takeaway from the visual
Construction sits toward the low-scoring side of the grid and is concentrated in the follower and middle buckets, while sectors such as advanced industries and telecom place more weight into the middle and leader positions.
Key standout values or extremes
Construction shows 58 percent in procurement followers and 42 percent in the middle of the pack with no visible leader bubble, while advanced industries show 32 percent followers, 60 percent in the middle, and 8 percent leaders.
Controls / sequence, when applicable
This is a static chart image with no in-chart controls to operate.
Companion media, when applicable
There is no separate companion audio or video; the chart image is the full visual on this page.