Source page: McKinsey & Company
Commentary
I saw the sign-ups
Healthcare
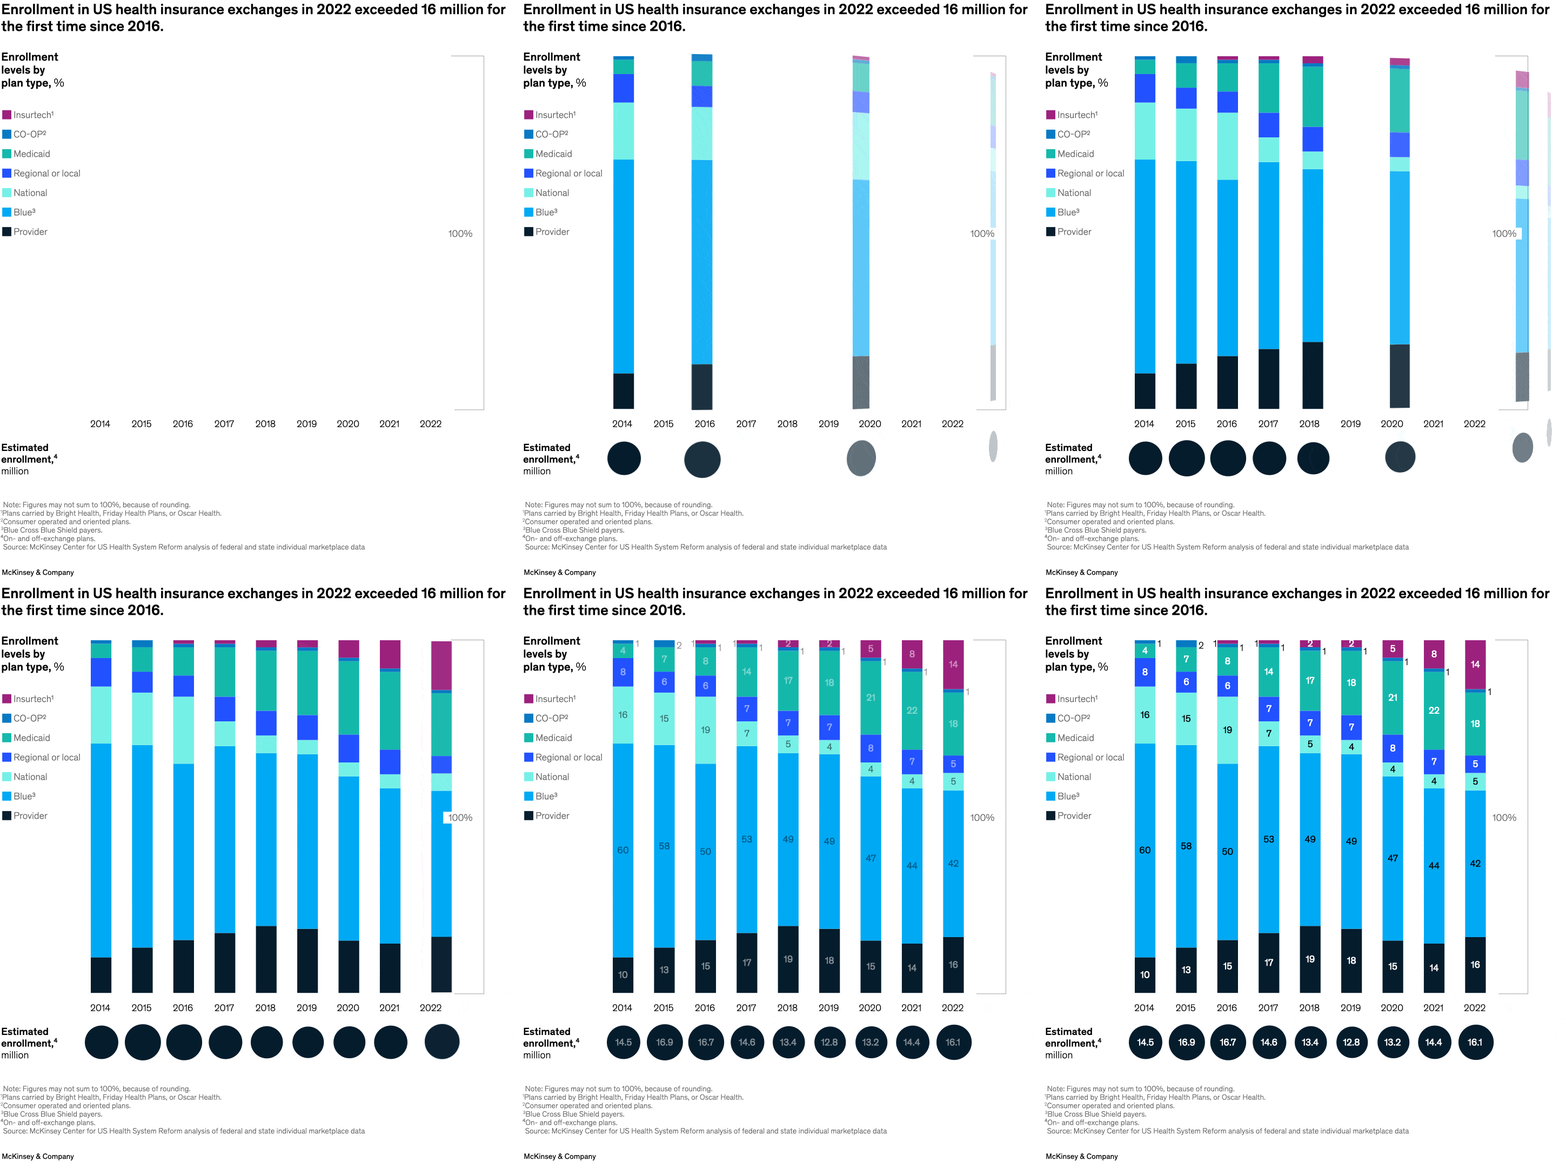
May 3, 2023 – Enrollment in the US individual health insurance marketplace exceeded 16 million last year, a 25 percent jump from 2020. The uptick is due, in part, to enhanced subsidies from the American Rescue Plan Act and extended enrollment periods. According to analysis by partner Brandon Flowers and colleagues, enrollment was up 12 percentage points since 2019 for insurtechs, but fell by double digits for some other large insurers.
To read the article, see “The individual health insurance market in 2023,” April 11, 2023.
customizer here
Visual form
100-percent stacked column chart with enrollment totals.
Layout / body structure
Nine annual columns run left to right from 2014 through 2022, each column stacked by plan type to 100 percent, and a second strip of dark circles along the bottom gives the total estimated enrollment in millions for each year.
What is being compared
It compares the changing mix of exchange enrollment by plan type over time and pairs that mix with total annual enrollment levels in US health insurance exchanges.
Measurement system
The stacked columns show percent share by plan type, while the bottom row shows estimated total enrollment in millions, so the reader tracks both composition and scale at the same time.
Visible structure inside the graphic
Each year uses one vertically stacked bar with segments for provider, Blue, national, regional or local, Medicaid, CO-OP, and insurtech plans, and the exact segment values are printed inside many of the colored blocks, while the enrollment circles below provide the total count for each year.
Main takeaway from the visual
The chart shows exchange enrollment reaching a new high in 2022 while the plan mix also changes over time, with Blue plans remaining the largest slice but shrinking from their earlier dominance as Medicaid and insurtech shares grow in later years.
Key standout values or extremes
Estimated enrollment rises to 16.1 million in 2022, the highest value in the row, after dipping to 12.8 million in 2019; within the stacked bars, Blue plans fall from 60 percent in 2014 to 42 percent in 2022, while insurtech grows from 1 percent in 2014 to 14 percent in 2022.
Controls / sequence, when applicable
This is a static chart image with no in-chart controls to operate.
Companion media, when applicable
There is no separate companion audio or video; the chart image is the full visual on this page.