Source page: McKinsey & Company
Commentary
Good eating
Public Health | Sustainability
May 1, 2023 – Increasing numbers of American consumers say eating healthfully and sustainably are priorities. Yet almost 50 percent of consumers aren’t sure how to pursue those goals. McKinsey’s latest Five Fifty explains that retailers and food producers can help by providing information about products’ health and sustainability impact.
To see the interactive, go to “Five Fifty: Food plight,” March 27, 2023.
customizer here
Visual form
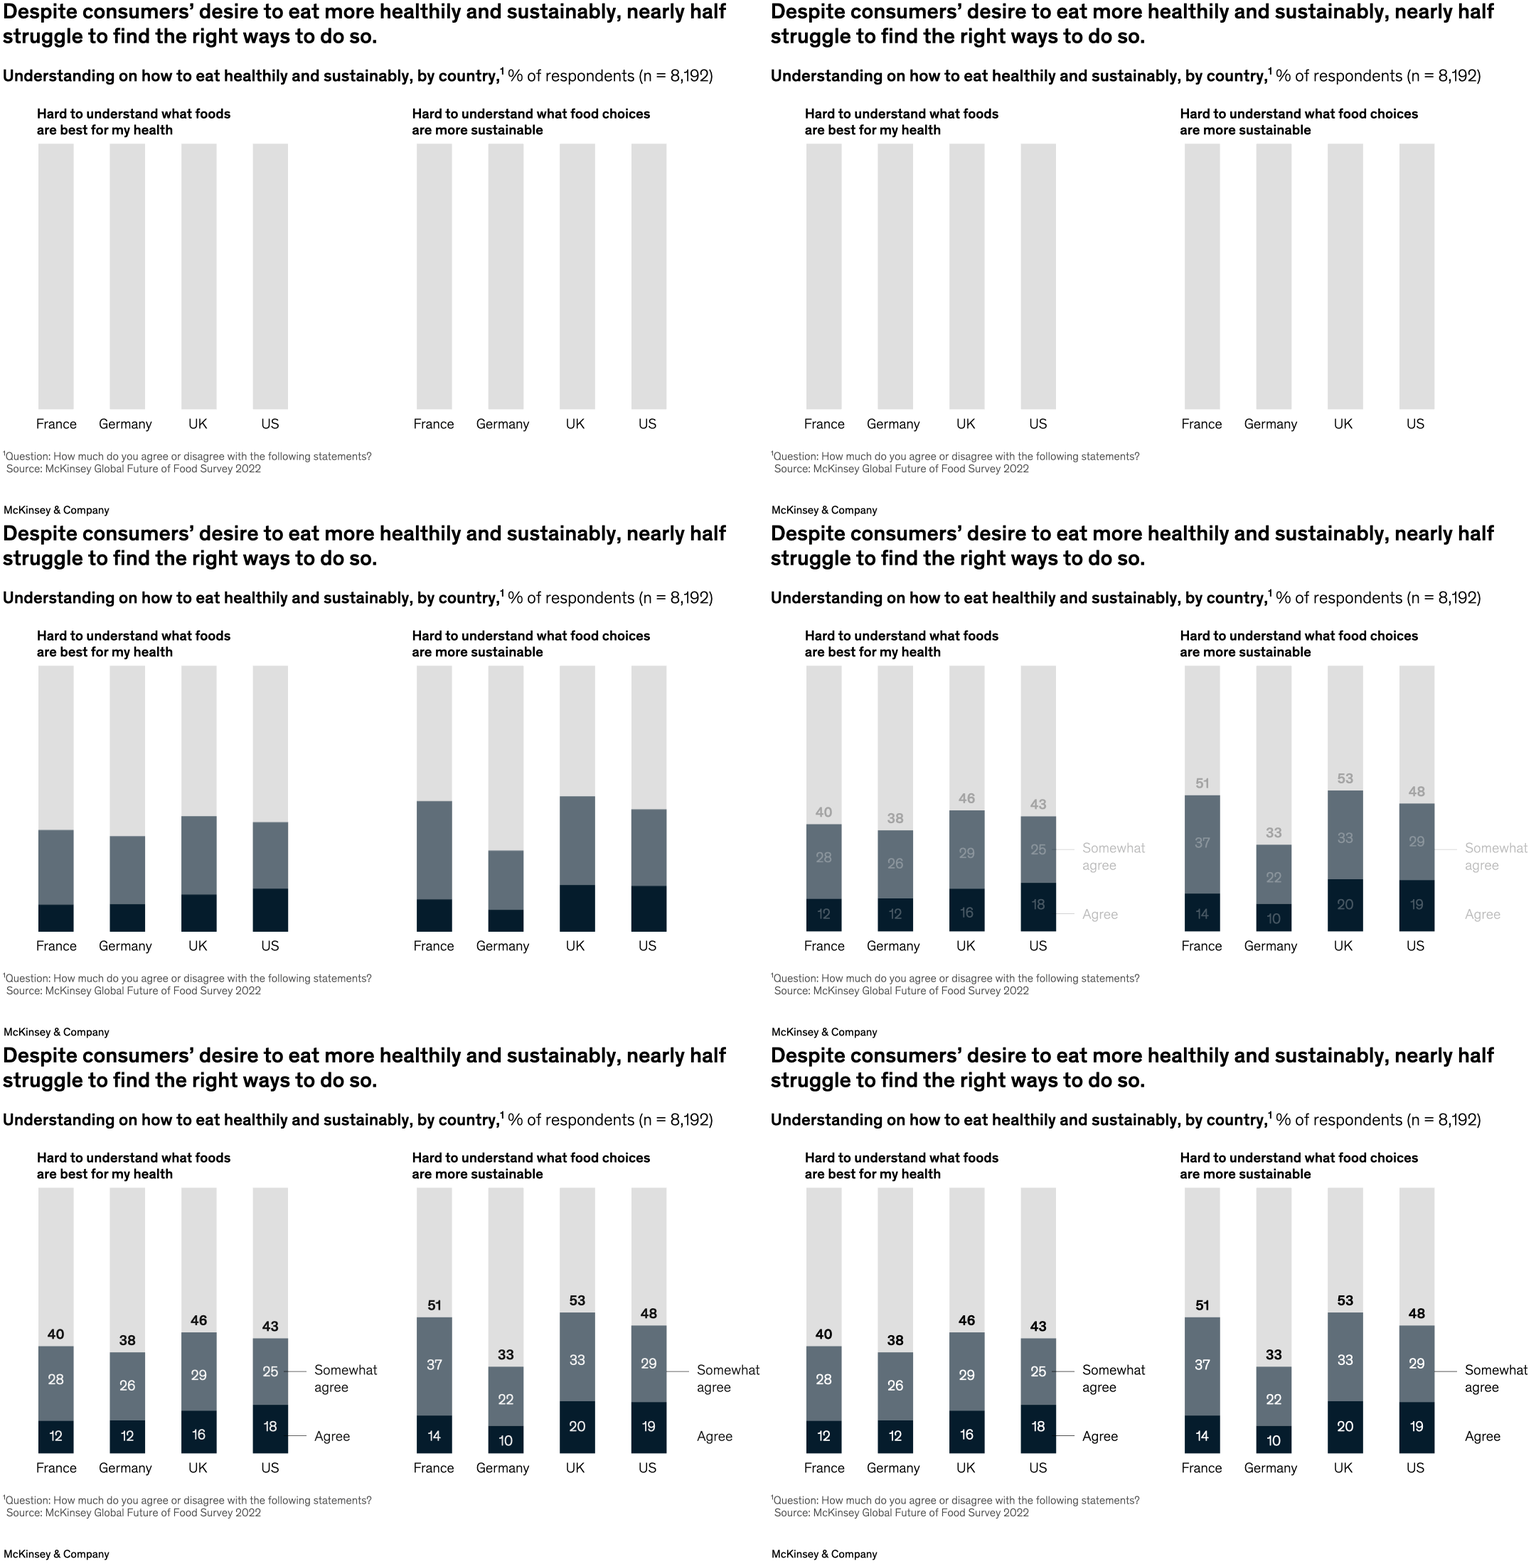
Two-panel stacked column survey chart.
Layout / body structure
The page splits the chart into two side-by-side panels, each with four country columns, so the reader compares one question on the left and a second question on the right using the same country order.
What is being compared
It compares how respondents in France, Germany, the UK, and the US say they struggle to understand healthy food choices on the left and sustainable food choices on the right.
Measurement system
The measure is percent of respondents, and each country column is segmented into agree and somewhat agree portions, with the remaining share left in light gray above them.
Visible structure inside the graphic
Every country is shown as one vertical bar with a dark base for agree, a medium segment for somewhat agree, and a light cap for the rest of respondents, while the right edge of each panel repeats the label positions so the two questions read like parallel survey views.
Main takeaway from the visual
Consumers report meaningful confusion on both dimensions, but the sustainability question generally produces taller combined agreement segments than the health question, especially in France, the UK, and the US.
Key standout values or extremes
On the health side, the combined agreement totals shown above the bars are 40 for France, 38 for Germany, 46 for the UK, and 43 for the US; on the sustainability side they are 51, 33, 53, and 48, with the UK highest and Germany lowest.
Controls / sequence, when applicable
This is a static chart image with no in-chart controls to operate.
Companion media, when applicable
There is no separate companion audio or video; the chart image is the full visual on this page.